Configuring WebFOCUS to Generate Narrative Charts
|
How to: |
In order to configure WebFOCUS to generate narrative charts, you must install the WebFOCUS Narrative Charts Server and, optionally, configure the URL to the WebFOCUS Narrative Charts Server in the WebFOCUS Administration Console.
Note: If you do not configure the URL to the WebFOCUS Narrative Charts Server in the WebFOCUS Administration Console, the Narrative charts button will not be activated in InfoAssist+. If you do configure the URL in the WebFOCUS Administration Console, you will find the Narrative button on the Format tab under Features when you create an HTML5 (FORMAT JSCHART) bar, line, area, or pie chart.
The WebFOCUS Narrative Charts Server is a separately licensed product that can be installed on Windows or Linux. Once you have licensed this feature, you can install the server using the instructions in the WebFOCUS Narrative Charts Installation and Configuration manual.
In order generate WebFOCUS narrative charts, you must either include the narrative text in your chart procedure or StyleSheet, configure the URL to the WebFOCUS Narrative Charts Server in the WebFOCUS Administration Console, or include the URL in the narrative chart properties in your chart procedure or StyleSheet. The order of precedence is:
- The URL configured in the WebFOCUS Administration Console. If neither the content nor the url property is specified in your procedure or StyleSheet, the URL configured in the WebFOCUS Administration Console will be used.
- A URL specified in the procedure or StyleSheet. If your procedure or the StyleSheet included in your procedure has a url property pointing to the WebFOCUS Narrative Charts Server, and the content property is omitted or set to undefined, the last URL found when parsing the procedure or StyleSheet will be used.
- Your own content. If you supply narrative text in the content property of your procedure or StyleSheet, it will be used.
Reference: Usage Notes for Narrative Charts
Narrative charts can have a maximum of 1,024 data points. This limit is imposed by the WebFOCUS Narrative Charts Server and will be removed in a future release. If the limit is exceeded, the message returned from the WebFOCUS Narrative Charts Server is
Failed to retrieve narrative text
Procedure: How to Configure the URL to the WebFOCUS Narrative Charts Server in the WebFOCUS Administration Console
- From the WebFOCUS Home Page, click Administration at the top right of the page, and click Administration Console.
The WebFOCUS Administration Console opens.
- Select Text Generation Server under Application Settings in the left pane, as shown in the following image.
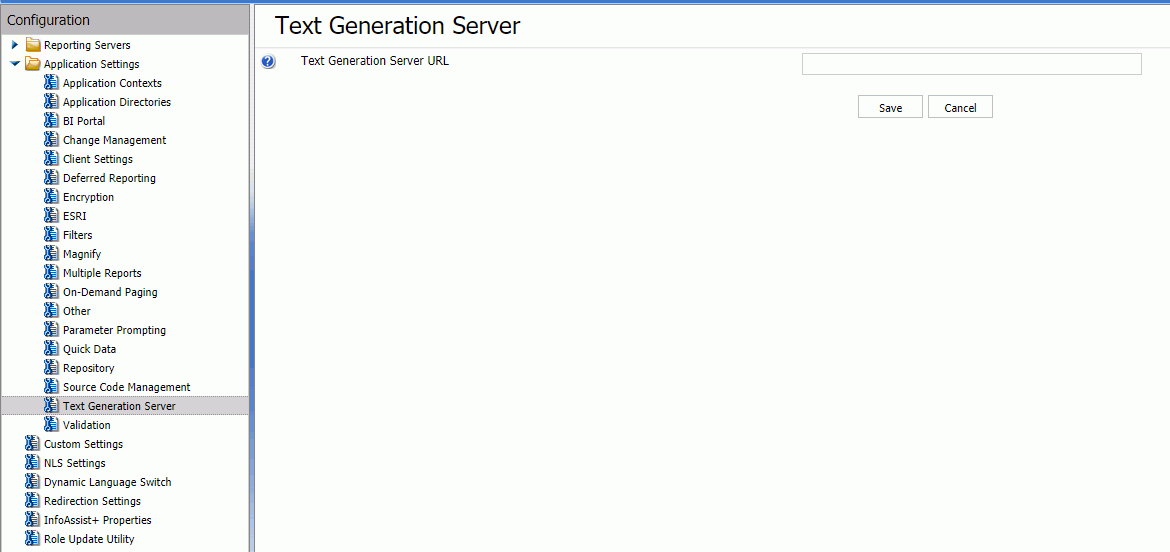
- Enter the URL to the WebFOCUS Narrative Charts Server in the Text Generation Server URL text box.
- Click Save.
- Clear the cache in the WebFOCUS Administration Console by clicking Clear Cache at the top right of the console page.
| WebFOCUS | |
|
Feedback |