Controlling the Location of the Legend Markers
|
How to: |
The markerPosition property controls the location of the legend markers relative to the legend labels.
Syntax: How to Control the Position of the Legend Markers
"legend": {"markerPosition": "string"}where:
- "markerPosition": "string"
-
Is a string that defines the location of legend markers relative to the legend label. Valid values are:
- "bottom"
- "left". This is the default value.
- "right"
- "top"
Example: Controlling the Position of the Legend Markers
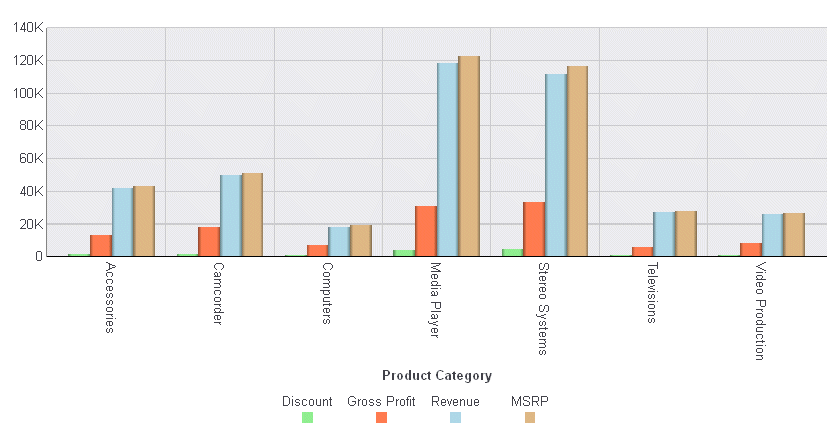
The following request places the legend markers below the legend labels:
GRAPH FILE WF_RETAIL_LITE
SUM DISCOUNT_US GROSS_PROFIT_US REVENUE_US MSRP_US
BY PRODUCT_CATEGORY
ON GRAPH PCHOLD FORMAT JSCHART
ON GRAPH SET LOOKGRAPH VBAR
ON GRAPH SET STYLE *
INCLUDE=IBFS:/FILE/IBI_HTML_DIR/javaassist/intl/EN/ENIADefault_combine.sty,$
*GRAPH_JS
"legend": {"markerPosition": "bottom"},
"series": [
	{"series": 0, "color": "lightgreen"},
	{"series": 1, "color": "coral"},
	{"series": 2, "color": "lightblue"},
	{"series": 3, "color": "burlywood"}
	]
*END
ENDSTYLE
END
The output is:

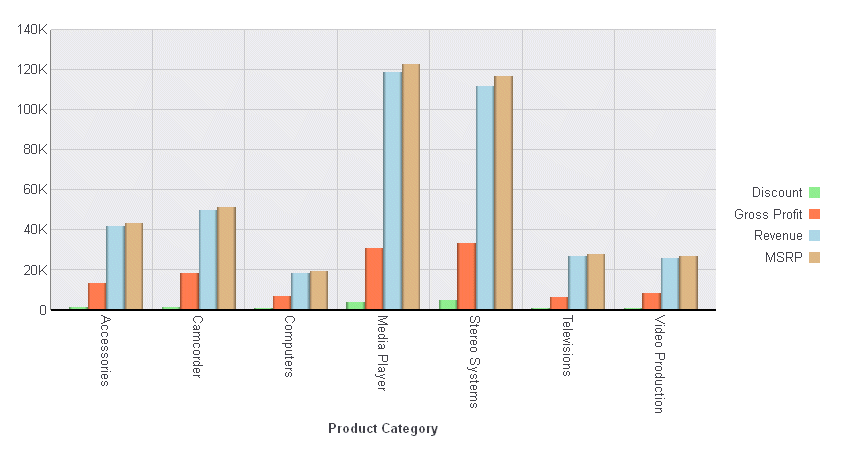
The following version of the request moves the legend to the right of the chart and places the legend markers to the right of the legend labels:
GRAPH FILE WF_RETAIL_LITE
SUM DISCOUNT_US GROSS_PROFIT_US REVENUE_US MSRP_US
BY PRODUCT_CATEGORY
ON GRAPH PCHOLD FORMAT JSCHART
ON GRAPH SET LOOKGRAPH VBAR
ON GRAPH SET STYLE *
INCLUDE=IBFS:/FILE/IBI_HTML_DIR/javaassist/intl/EN/ENIADefault_combine.sty,$
*GRAPH_JS
"legend": {
	"position": "right",
	"markerPosition": "right"
	},
"series": [
	{"series": 0, "color": "lightgreen"},
	{"series": 1, "color": "coral"},
	{"series": 2, "color": "lightblue"},
	{"series": 3, "color": "burlywood"}
	]
*END
ENDSTYLE
END
The output is:

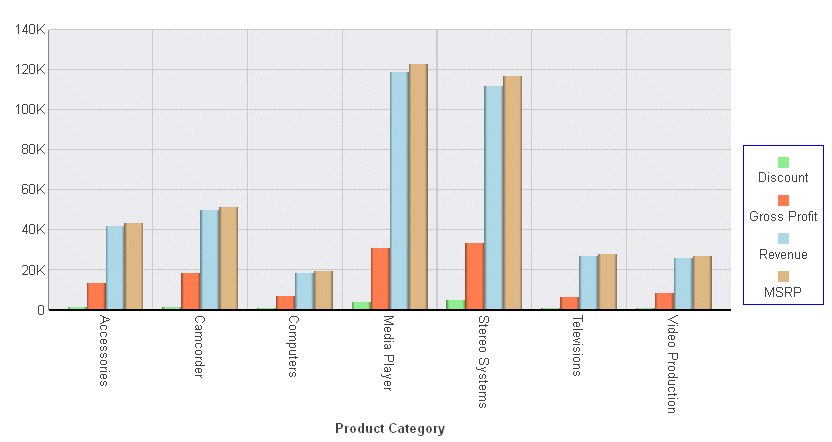
The following legend properties change the marker position to 'top' with the legend position to the right. They also draw a border around the legend:
"legend": {
	"position": "right",
	"markerPosition": "top",
	"lineStyle": {
		"color": "blue"}}
These legend properties generate the following chart:

| WebFOCUS | |
|
Feedback |