Generating a Line Around the Legend Area
|
How to: |
The lineStyle property controls the width and color of a line that can be drawn around the legend area.
Syntax: How to Generate a Line Around the Legend Area
"legend": {
			"lineStyle": {
      "width": number,
      "color": "color",
      "dash": "string"'
   }
}
where:
- "width": number,
-
Is a number that defines the width of the line in pixels. The default value is 0, no line.
- "color": "color"
-
Defines the color of the line as either:
- A string, enclosed in single quotation marks, that defines a color by a name or numeric specification string or defines a gradient string. The default value is "black".
- A JSON object that defines a gradient.
- "dash": "string"
-
Is a string that defines the dash style of the line. The default value is "" (which generates a solid line). Use a string of numbers that defines the width of a dash followed by the width of the gap between dashes.
Example: Generating a Line Around the Legend Area
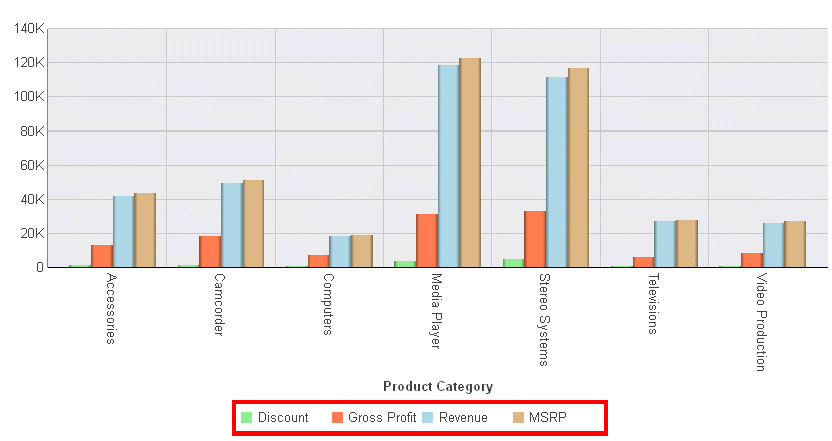
The following request generates a four-pixel wide red line around the legend area:
GRAPH FILE WF_RETAIL_LITE
SUM DISCOUNT_US GROSS_PROFIT_US REVENUE_US MSRP_US
BY PRODUCT_CATEGORY
ON GRAPH PCHOLD FORMAT JSCHART
ON GRAPH SET LOOKGRAPH VBAR
ON GRAPH SET STYLE *
INCLUDE=IBFS:/FILE/IBI_HTML_DIR/javaassist/intl/EN/ENIADefault_combine.sty,$
*GRAPH_JS
"legend": {"lineStyle": {
	"width": 4,
	"color": "red"}},
"series": [
	{"series": 0, "color": "lightgreen"},
	{"series": 1, "color": "coral"},
	{"series": 2, "color": "lightblue"},
	{"series": 3, "color": "burlywood"}
	]
*END
ENDSTYLE
END
The output is:

| WebFOCUS | |
|
Feedback |