Controlling Space Between Risers in 3D Charts
|
How to: |
In 3D charts and charts where 2.5D depth is applied with the depth property, the riserDepthGap property adds space between risers that draw behind other risers.
Syntax: How to Control Space Between Risers in 3D Charts
"riserDepthGap": number
where:
- "riserDepthGap": number
-
Is a number between 0 and 1 that defines the margin between the risers as a factor of the depth. The default value is 0.2.
Example: Controlling the Space Between Risers in 3D Charts
The following request generates a 3D area chart with the default space between the risers:
DEFINE FILE WF_RETAIL_LITE
DIFFA = GROSS_PROFIT_US - REVENUE_US;
DIFFB = REVENUE_US - GROSS_PROFIT_US;
DIFFC = COGS_US - (COGS_US * DISCOUNT_US)/100;
DIFFD = COGS_US - MSRP_US;
END
GRAPH FILE WF_RETAIL_LITE
SUM DIFFA DIFFB DIFFC DIFFD
BY PRODUCT_CATEGORY
ON GRAPH PCHOLD FORMAT JSCHART
ON GRAPH SET LOOKGRAPH 3DAREAS
ON GRAPH SET STYLE *
*GRAPH_JS
"riserDepthGap": 0.2,
"chartFrame": {
	"border": {"width": 1, "color": "grey"},
	"fill": {"color": "ghostwhite"}},
"colorMode": {
	"mode": "byInterpolation",
	"colorList": ["red", "blue"]
	}
*END
ENDSTYLE
END
The output is:
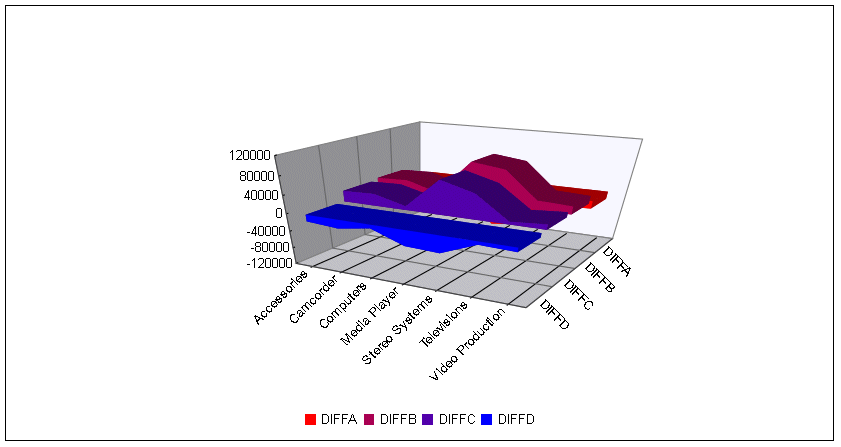
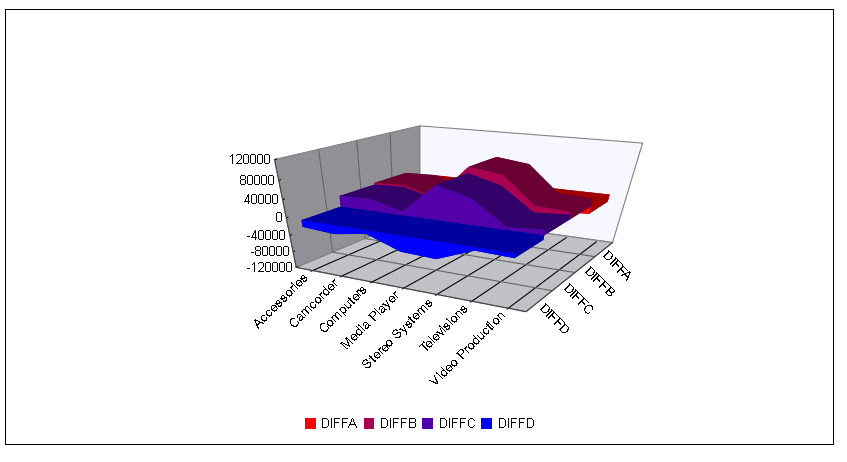
Changing the riserDepthGap to zero (0) generates the following chart:
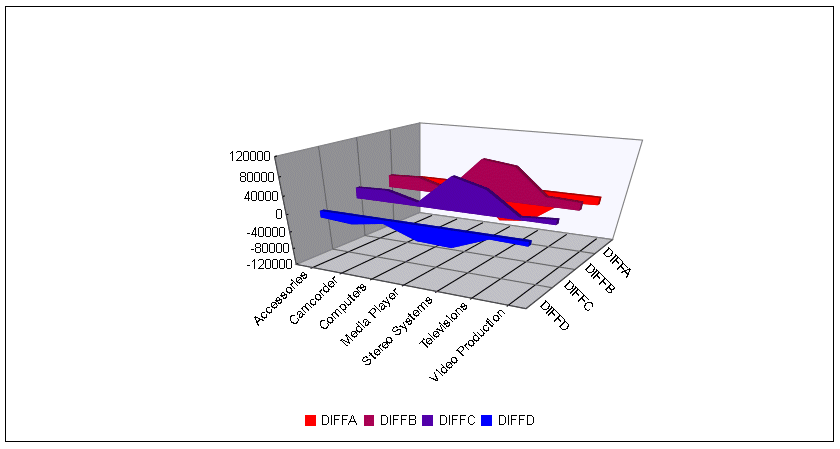
The value 0.9 for riserDepthGap generates the following chart:
| WebFOCUS | |
|
Feedback |