Applying a Bevel to Risers, Markers, and Slices
|
How to: |
The riserBevel property applies a bevel to risers in a bar chart, markers in bubble and scatter charts, and slices in a pie chart.
Syntax: How to Apply a Bevel to Risers, Markers, and Slices
"riserBevel": "string"
where:
- "riserBevel": "string"
-
Is a string that defines the bevel type. The default value is undefined.
- For bar charts,
the values can be:
- "bevel"
-
Applies a slight angle at the edges of the risers, giving them a beveled appearance.
- "cylinder"
-
Draws the risers as cylinders with gradient color.
- "darken"
-
Applies a gradient to the risers that darkens toward the bottom for vertical risers, and darkens toward the left for horizontal risers.
- "darkenInverted"
-
Applies a gradient to the risers that darkens toward the top for vertical risers, and darkens toward the right for horizontal risers.
- "lighten"
-
Applies a gradient to the risers that lightens toward the bottom for vertical risers, and lightens toward the left for horizontal risers.
- "lightenInverted"
-
Applies a gradient to the risers that lightens toward the top for vertical risers, and lightens toward the left for horizontal risers.
- For bubble and scatter charts,
the values can be:
- "darken"
-
Applies a circular gradient to the markers that transitions from the original marker color to a darker color.
- "lighten"
-
Applies a circular gradient to the markers that transitions from the original marker color to a lighter color.
- For pie charts,
the values can be:
- "bevel"
-
Applies an angle at the outer edge of the pie.
- "cylinder"
-
Makes the pie look more cylindrical using a darkening gradient effect.
- "donut"
-
Draws the pie with a donut effect if it has a hole.
- For bar charts,
the values can be:
Bevel types darken and lighten will also be applied to legend markers (if visible).
Example: Generating a Bar Chart With Bevel Effects
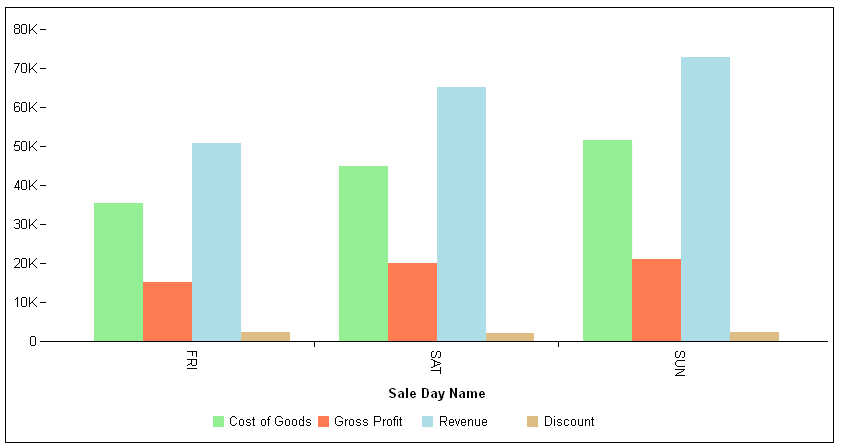
The following request generates a bar chart with no bevel effect:
GRAPH FILE WF_RETAIL_LITE
SUM COGS_US GROSS_PROFIT_US REVENUE_US DISCOUNT_US
ACROSS TIME_DAYNAME
WHERE TIME_DAYNAME EQ 'FRI' OR 'SAT' OR 'SUN'
ON GRAPH PCHOLD FORMAT JSCHART
ON GRAPH SET LOOKGRAPH VBAR
ON GRAPH SET STYLE *
*GRAPH_JS
"series": [
	{"series": 0, "color": "lightgreen"},
	{"series": 1, "color": "coral"},
	{"series": 2, "color": "lightblue"},
	{"series": 3, "color": "burlywood"}
	]
*END
ENDSTYLE
END
The output is:

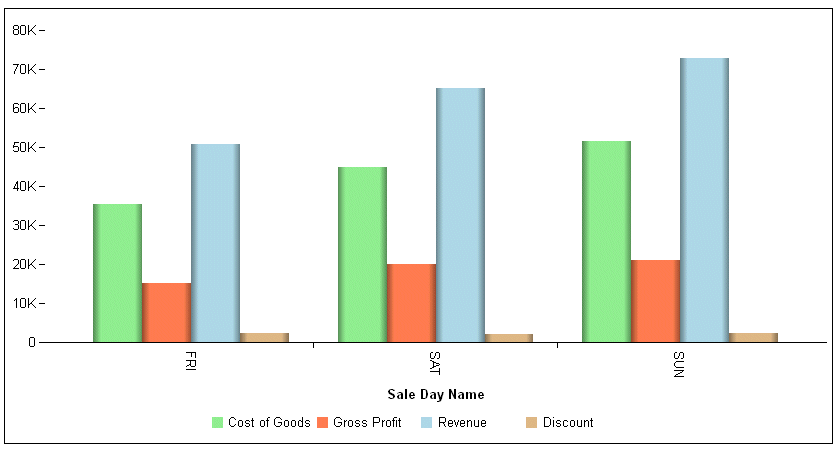
The following version of the request applies the "riserBevel": "bevel" effect:
GRAPH FILE WF_RETAIL_LITE
SUM COGS_US GROSS_PROFIT_US REVENUE_US DISCOUNT_US
ACROSS TIME_DAYNAME
WHERE TIME_DAYNAME EQ 'FRI' OR 'SAT' OR 'SUN'
ON GRAPH PCHOLD FORMAT JSCHART
ON GRAPH SET LOOKGRAPH VBAR
ON GRAPH SET STYLE *
*GRAPH_JS
"riserBevel": "bevel",
"series": [
	{"series": 0, "color": "lightgreen"},
	{"series": 1, "color": "coral"},
	{"series": 2, "color": "lightblue"},
	{"series": 3, "color": "burlywood"}
	]
*END
ENDSTYLE
END
On the output, the risers are not totally flat. They have a slight angle at their edges:

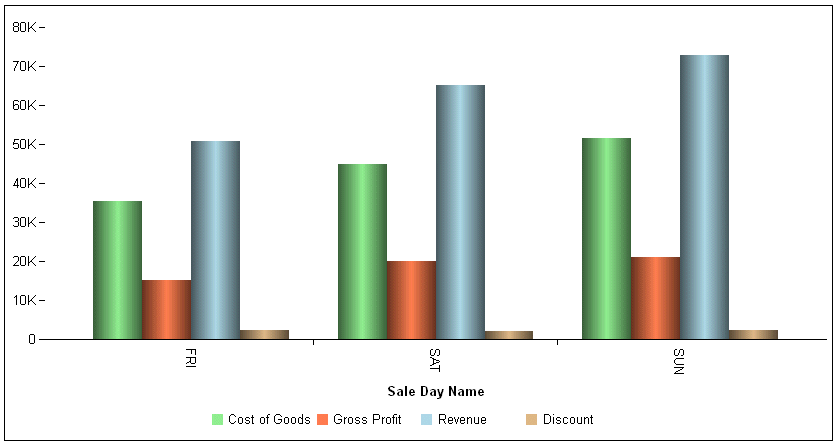
Changing the property to "riserBevel": "cylinder" generates the following chart, in which the risers are drawn as cylinders with gradient color:

Example: Applying a Bevel Effect to a Bubble Chart
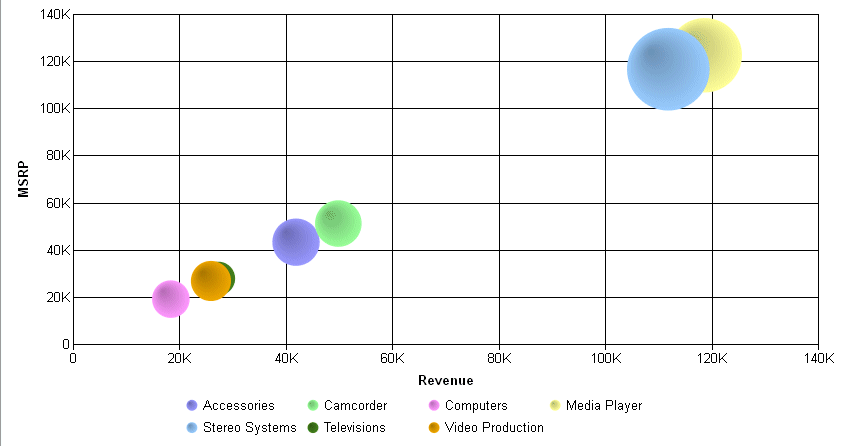
The following request applies the bevel effect "darken" to the bubble markers and legend markers:
GRAPH FILE WF_RETAIL_LITE
SUM  REVENUE_US MSRP_US DISCOUNT_US
BY PRODUCT_CATEGORY
ON GRAPH PCHOLD FORMAT JSCHART
ON GRAPH SET LOOKGRAPH BUBBLE
ON GRAPH SET STYLE *
*GRAPH_JS
"border": {"width": 0},
"series": [{"series": "all",	"marker": {"shape": "circle"}}],
"riserBevel": "darken"
*END
ENDSTYLE
END
The output is:

| WebFOCUS | |
|
Feedback |