Controlling the Number of Charts in a Horizontal Row
|
How to: |
For pie, gauge, and funnel charts that can have multiple charts in a single draw area, the chartsPerRow property defines how many charts to draw in a horizontal row.
Syntax: How to Control the Number of Charts Per Row
"chartsPerRow": number
where:
- "chartsPerRow": number
-
Is the number of charts to draw in a horizontal row. The default value is undefined.
Example: Controlling the Number of Charts Per Row
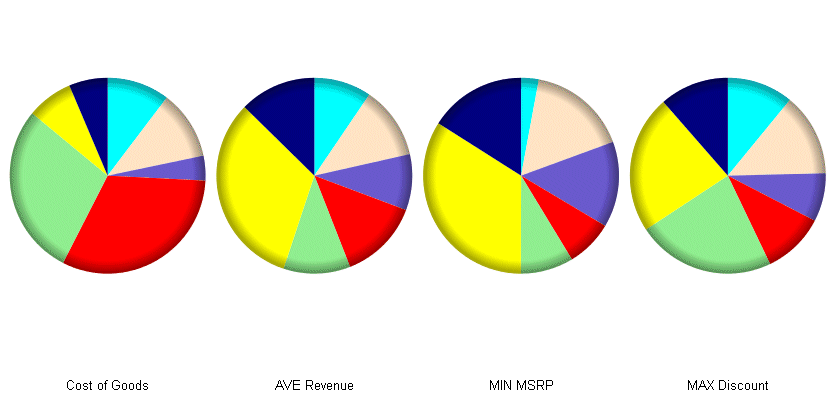
The following request generates four pie charts. The chartsPerRow property places them all on one horizontal row:
GRAPH FILE WF_RETAIL_LITE
SUM COGS_US AVE.REVENUE_US MIN.MSRP_US MAX.DISCOUNT_US
ACROSS PRODUCT_CATEGORY
ON GRAPH PCHOLD FORMAT JSCHART
ON GRAPH SET LOOKGRAPH PIE
ON GRAPH SET STYLE *
INCLUDE=IBFS:/FILE/IBI_HTML_DIR/javaassist/intl/EN/ENIADefault_combine.sty,$
*GRAPH_JS
"chartsPerRow": 4,
"legend": {"visible": false},
"series": [
	{"series": 0, "color": "cyan"},
	{"series": 1, "color": "bisque"},
	{"series": 2, "color": "slateblue"},
	{"series": 3, "color": "red"},
	{"series": 4, "color": "lightgreen"},
	{"series": 5, "color": "yellow"},
	{"series": 6, "color": "navy"},
	{"series": 7, "color": "lavender"},
	{"series": 8, "color": "limegreen"},
	{"series": 9, "color": "red"}
	]
*END
ENDSTYLE
END
The output is:

| WebFOCUS | |
|
Feedback |