Formatting the Chart Footnote
|
How to: |
The footnote properties control the content, visibility, and format of the chart footnote.
Syntax: How to Format the Chart Footnote
"footnote": {
   "text": "string",
   "visible": boolean,
   "align": "string",
   "font": "string",
   "color": "string"

}
where:
- "text": "string"
-
Is a string that defines the footnote text. The default value is "Chart Footnote".
- "visible": boolean
-
Controls the visibility of the chart footnote. Valid values are:
- true, which makes the chart footnote visible.
- false, which makes the chart footnote not visible. This is the default value.
- "align": "string"
-
Is a string that defines the alignment of the footnote, Valid values are:
- "center", which centers the footnote in the draw area. This is the default value.
- "chartFrame", which centers the footnote aligned with the chart frame.
- "left", which left-justifies the chart footnote in the draw area.
- "right", which right-justifies the chart footnote in the draw area.
- "font": "string"
-
Is a string that defines the size, style, and, typeface of the chart footnote. The default value is "10pt Sans-Serif".
- "color": "string"
-
Is a string that defines the color of the chart footnote using a color name or numeric specification string. The default value is "black".
For information about specifying colors, see Colors and Gradients.
- "backgroundColor": "string"
-
Is a color specification string or gradient definition that defines the background fill color of the chart title object. The default value is undefined.
- "border"
-
Defines the properties of the border around the chart title object.
- "width": number
-
Defines the width of the border in pixels. The default value is 0 (zero).
- "color": "string"
-
Is a color specification string that defines the color of the border around the chart title object. The default value is undefined.
- "dash": "string"
-
Is a string that defines the dash style of the border around the chart title object. Enter the length of the dash in pixels followed by the length of the space between dashes in pixels. The default value is no dash (" ").
- "cornerRadius": {"x": value, "y": value}
-
Defines the properties of the corners of the box around the title object.
The cornerRadius property can consist of one value or two values. When there is one value that is zero (0), the corners are square. This is the default corner shape. Rounded corners can be circular or elliptical. The x and y values denote the size of the circle radius or the semi-major and semi-minor axes of the ellipse.
Valid values for x and y are:
- A number that specifies the radius of the corner in pixels.
- A percent string such as "20%", that represents a percentage of the height (y) or width (x) of the box around the title object.
- A CSS length string such as "5em" or "10px" that specifies the radius of the corner in pixels. For information about CSS length strings, see https://developer.mozilla.org/en-US/docs/Web/CSS/length.
- An object with "x" and "y" properties (where "x" and "y" can be any of the above) to specify the corner radius along the width (x) and height (y) of the title object box.
Example: Formatting the Chart Footnote
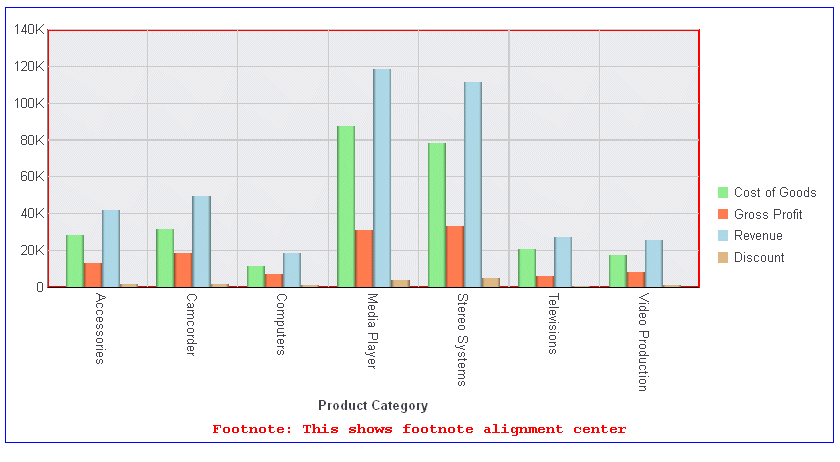
The following request generates a vertical bar chart with a footnote. The alignment of the footnote, and part of the text, depends on the Dialogue Manager variable named &FOOTALIGN, which is set to the value 'center':
-SET &FOOTALIGN = 'center';
GRAPH FILE WF_RETAIL_LITE
SUM COGS_US GROSS_PROFIT_US REVENUE_US DISCOUNT_US
ACROSS PRODUCT_CATEGORY
ON GRAPH PCHOLD FORMAT JSCHART
ON GRAPH SET LOOKGRAPH VBAR
ON GRAPH SET STYLE *
INCLUDE=IBFS:/FILE/IBI_HTML_DIR/javaassist/intl/EN/ENIADefault_combine.sty,$
*GRAPH_JS
"border": {"color": "blue"},
"chartFrame": {"border": {
	"width": 2, "color": "red"}},
"legend": {"position": "right"},
"footnote": {
	"text": "Footnote: This shows footnote alignment &FOOTALIGN",
	"font": "Bold 10pt Courier", "visible": true,
	"align": "&FOOTALIGN","color": "red"},
"series": [
	{"series": 0, "color": "lightgreen"},
	{"series": 1, "color": "coral"},
	{"series": 2, "color": "lightblue"},
	{"series": 3, "color": "burlywood"}
	]
*END
ENDSTYLE
END
On the output, with alignment 'center', the footnote is centered in the draw area:

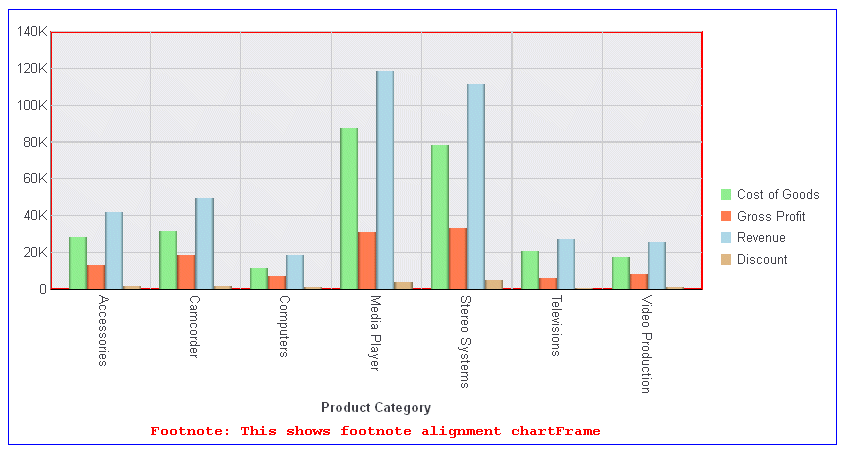
Changing the value of &FOOTALIGN to 'chartFrame' generates a footnote centered aligned with the chart frame:

| WebFOCUS | |
|
Feedback |