Converting Streamgraph Chart Requests to Chart Attribute Syntax
|
Reference: |
A streamgraph is a simplified version of a stacked area chart.
Reference: LOOKGRAPH Conversions for Streamgraph Charts
The following table lists the traditional LOOKGRAPH values and the new LOOKGRAPH values.
|
LOOKGRAPH Parameter |
|
|---|---|
|
Traditional |
Convert to |
|
STREAM |
STREAM |
Reference: Attribute Category Assignments Streamgraph Charts
The following table lists the attribute category conversions for streamgraph charts.
|
Type of Column or Parameter |
Attribute Category |
|---|---|
|
measure field |
y-axis |
|
sort field |
x-axis |
Note: Merge parameters are not supported with streamgraphs.
Example: Converting a Streamgraph Chart Request to Chart Attribute Syntax
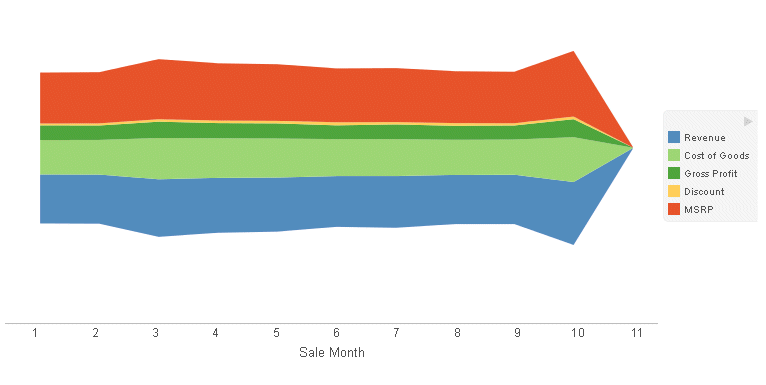
The following example generates a streamgraph chart. The measures are REVENUE_US, COGS_US, GROSS_PROFIT_US, DISCOUNT_US, and MSRP_US. The sort field is TIME_MTH:
GRAPH FILE WF_RETAIL_LITE
SUM REVENUE_US COGS_US GROSS_PROFIT_US DISCOUNT_US MSRP_US
BY TIME_MTH
ON GRAPH PCHOLD FORMAT JSCHART
ON GRAPH SET LOOKGRAPH STREAM
ON GRAPH SET STYLE *
INCLUDE=IBFS:/FILE/IBI_HTML_DIR/javaassist/intl/EN/combine_templates/ENWarm.sty,$
ENDSTYLE
END
The output is shown in the following image:

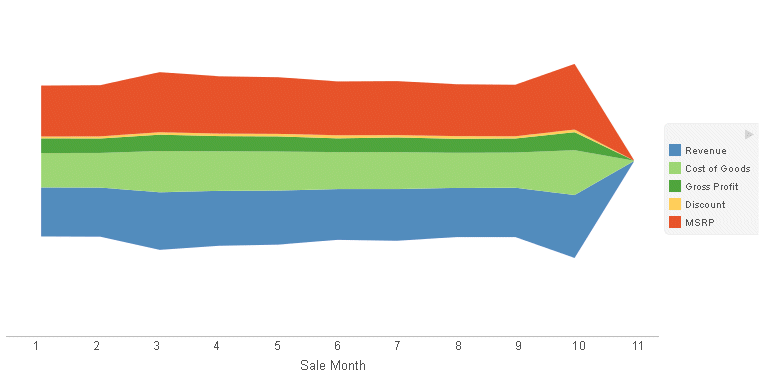
The following is the same request converted to chart attribute syntax. The TIME_MTH sort field is assigned to the x-axis category, and the measures are assigned to the y-axis category.
GRAPH FILE WF_RETAIL_LITE
SUM REVENUE_US COGS_US GROSS_PROFIT_US DISCOUNT_US MSRP_US
BY TIME_MTH
ON GRAPH PCHOLD FORMAT JSCHART
ON GRAPH SET LOOKGRAPH STREAM
ON GRAPH SET STYLE *
type=data, column=revenue_us, bucket=y-axis,$
type=data, column=COGS_US, bucket=y-axis,$
type=data, column=GROSS_PROFIT_US, bucket=y-axis,$
type=data, column=DISCOUNT_US, bucket=y-axis,$
type=data, column=MSRP_US, bucket=y-axis,$
type=data, column=time_mth, bucket=x-axis,$
INCLUDE=IBFS:/FILE/IBI_HTML_DIR/javaassist/intl/EN/combine_templates/ENWarm.sty,$
ENDSTYLE
END
The output is shown in the following image.

| WebFOCUS | |
|
Feedback |