Converting Spectral Chart Requests to Heatmap Chart Requests
|
Reference: |
A heatmap chart is a matrix in which each cell is filled with a color that represents the value of the measure for that cell.
Traditional WebFOCUS chart syntax does not have a heatmap chart type. It has a spectral chart type, which is similar. However, spectral charts support multiple unrelated measures, while heatmaps support only a single measure. To convert a spectral chart with multiple measures, you have to issue separate heatmap chart requests for each measure.
Reference: LOOKGRAPH Conversions for Heatmap Charts
The following table lists the traditional LOOKGRAPH value and the new LOOKGRAPH value.
|
LOOKGRAPH Parameter |
|
|---|---|
|
Traditional |
Convert to |
|
SPECTRAL |
HEATMAP |
Reference: Attribute Category Assignments for Heatmap Charts
The following table lists the attribute category conversions for heatmap charts. The GRLEGEND and GRXAXIS parameters can be used interchangeably.
|
Type of Column or Parameter |
Attribute Category |
|---|---|
|
measure field |
color |
|
GRLEGEND sort field |
y-axis |
|
GRXAXIS (ACROSS) sort field |
x-axis |
|
GRMULTIGRAPH sort field |
page |
Example: Converting a Spectral Chart Request to a Heatmap Chart Request
The following example generates multiple spectral charts using traditional syntax (LOOKGRAPH value is SPECTRAL). The high-level sort field (BRANDTYPE) is the GRMULTIGRAPH sort field. Separate spectral charts are generated for each value of BRANDTYPE. The BRAND sort field generates the y-axis, and the QUANTITY_SOLD sort field generates the x-axis. The measure (COGS_US) is used for the color of the rectangles. The VZERO parameter is set to match the default value for chart attribute syntax requests.
GRAPH FILE WF_RETAIL_LITE
SUM COGS_US
BY BRANDTYPE
BY BRAND
ACROSS QUANTITY_SOLD
ON GRAPH SET VZERO OFF
ON GRAPH SET GRMERGE ADVANCED
ON GRAPH SET GRMULTIGRAPH 1
ON GRAPH SET GRLEGEND 1
ON GRAPH SET GRXAXIS 1
ON GRAPH PCHOLD FORMAT JSCHART
ON GRAPH SET LOOKGRAPH SPECTRAL
ON GRAPH SET STYLE *
INCLUDE=IBFS:/FILE/IBI_HTML_DIR/javaassist/intl/EN/combine_templates/ENWarm.sty,$
ENDSTYLE
END
The output is shown in the following image:
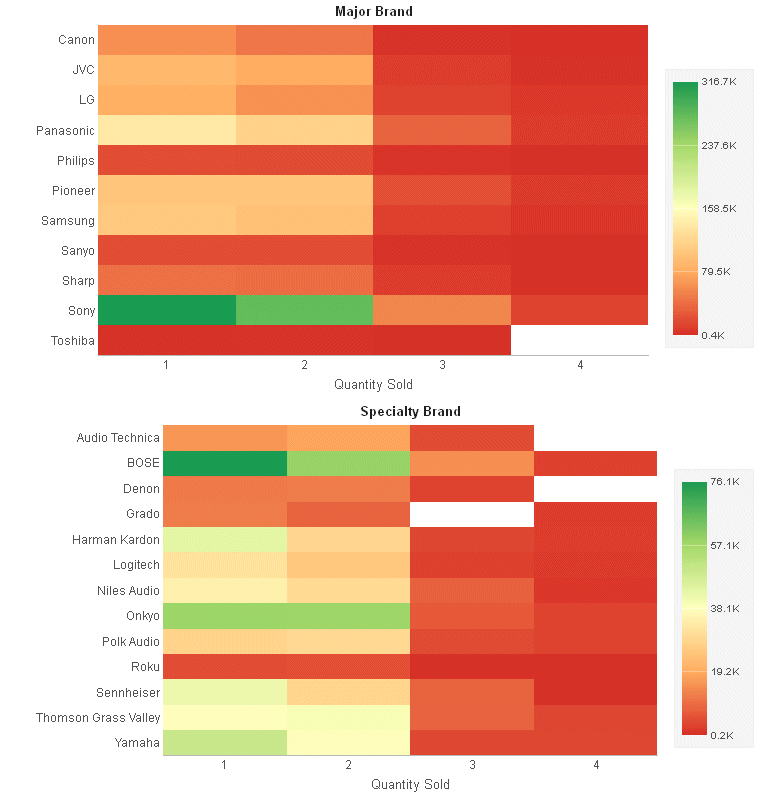
The following is the same request converted to chart attribute syntax. The LOOKGRAPH value is HEATMAP. The measure (COGS_US) is assigned to the color attribute category, the high-level sort field (BRANDTYPE) is assigned to the page attribute category, the BRAND sort field is assigned to the y-axis category, and the QUANTITY_SOLD sort field is assigned to the x-axis attribute category. The ACROSS phrase is changed to BY:
GRAPH FILE WF_RETAIL_LITE
HEADING CENTER
"<BRANDTYPE "
SUM COGS_US
BY BRANDTYPE
BY BRAND
BY QUANTITY_SOLD
ON GRAPH PCHOLD FORMAT JSCHART
ON GRAPH SET EMBEDHEADING ON
ON GRAPH SET LOOKGRAPH HEATMAP
ON GRAPH SET STYLE *
INCLUDE=IBFS:/FILE/IBI_HTML_DIR/javaassist/intl/EN/combine_templates/ENWarm.sty,$
type=data, column=brandtype, bucket=page,$
type=data, column=cogs_us, bucket=color,$
type=data, column=brand, bucket=y-axis,$
type=data, column=quantity_sold, bucket=x-axis,$
ENDSTYLE
END
The output is shown in the following image:

| WebFOCUS | |
|
Feedback |