Converting Scatter Chart Requests to Chart Attribute Syntax
|
Reference: |
Scatter charts generally plot one measure against another, although WebFOCUS provides LOOKGRAPH values that support dimensions as well.
Reference: LOOKGRAPH Conversions for Scatter Charts
The following table lists the traditional LOOKGRAPH values and the new LOOKGRAPH values.
|
LOOKGRAPH Parameter |
|
|---|---|
|
Traditional |
Convert to |
|
SCATTER |
SCATTER |
|
SCATTERN |
SCATTER |
|
SCATTERS |
SCATTER |
Reference: Attribute Category Assignments for SCATTER Charts
The following table lists the attribute category conversions for SCATTER charts. Charts with LOOKGRAPH SCATTER have a numeric sort field, which is displayed on the x-axis, and numeric measures that are displayed on the y-axis.
Note: Merge parameters are not supported with LOOKGRAPH SCATTER.
|
Type of Column or Parameter |
Attribute Category |
|---|---|
|
Measure field. |
y-axis |
|
Sort field. Must be numeric for SCATTER. |
x-axis |
|
High-level sort field |
page |
Example: Converting a SCATTER Chart Request to Chart Attribute Syntax
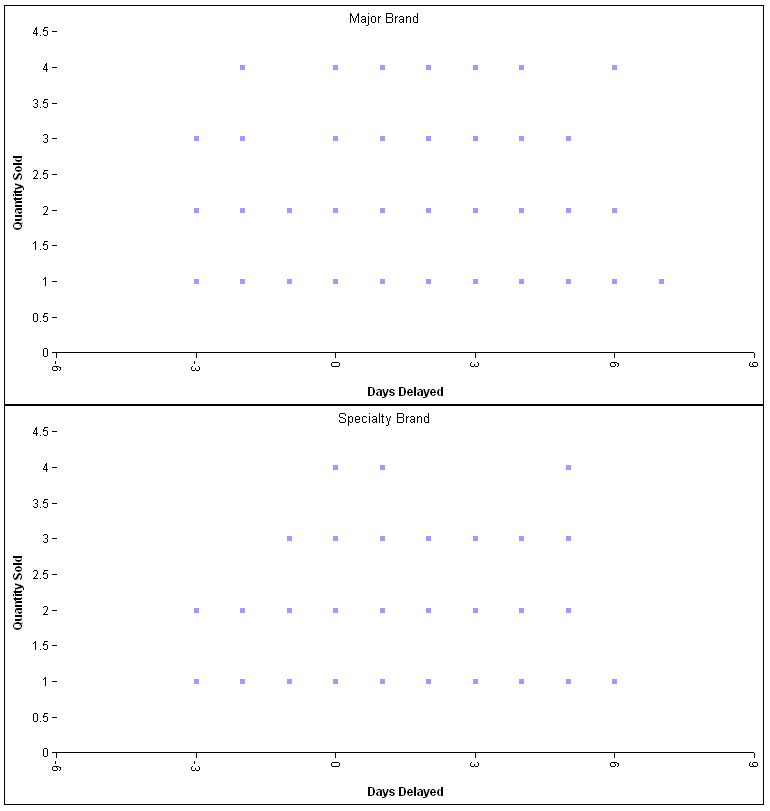
The following example generates multiple scatter charts using traditional syntax (LOOKGRAPH value is SCATTER). The high-level sort field (BRANDTYPE) is the sort field that generates multiple charts, the measure (QUANTITY_SOLD) is plotted on the y-axis, and the numeric sort field (DAYSDELAYED) is plotted on the x-axis:
GRAPH FILE WF_RETAIL_LITE
HEADING CENTER
"<BRANDTYPE "
PRINT QUANTITY_SOLD
BY BRANDTYPE
BY DAYSDELAYED
ON GRAPH SET EMBEDHEADING ON
ON GRAPH SET LOOKGRAPH SCATTER
ON GRAPH PCHOLD FORMAT JSCHART
END
The output is shown in the following image:
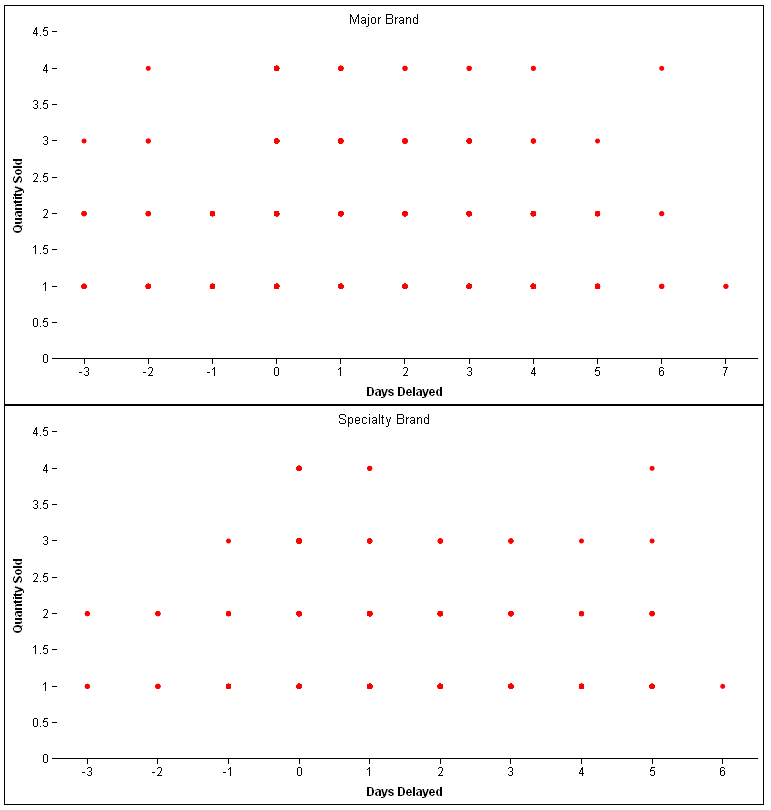
The following is the same request converted to chart attribute syntax. The LOOKGRAPH value is SCATTER. The measure (QUANTITY_SOLD) is assigned to the y-axis category, the numeric sort field (DAYSDELAYED) is assigned to the x-axis attribute category, and the high-level sort field (BRANDTYPE) is assigned to the page attribute category.
GRAPH FILE WF_RETAIL_LITE
HEADING CENTER
"<BRANDTYPE "
PRINT QUANTITY_SOLD
BY BRANDTYPE
BY DAYSDELAYED
ON GRAPH SET EMBEDHEADING ON
ON GRAPH SET LOOKGRAPH SCATTER
ON GRAPH PCHOLD FORMAT JSCHART
ON GRAPH SET STYLE *
type=data, column=quantity_sold, bucket=y-axis,$
type=data, column=daysdelayed, bucket=x-axis,$
type=data, column=brandtype, bucket=page,$
*GRAPH_JS
"xaxis": {"majorGrid": {"visible": false}},
"yaxis": {"majorGrid": {"visible": false}}
*END
END
The output is shown in the following image:
Reference: Attribute Category Assignments for SCATTERN Charts
Charts with LOOKGRAPH SCATTERN must have two measures for the axes, and the sort field represents the plotted points.
The following table lists the attribute category conversions for SCATTERN charts.
|
Type of Column or Parameter |
Attribute Category |
|---|---|
|
Measure field. |
x-axis |
|
Measure field. |
y-axis |
|
GRLEGEND or GRXAXIS sort field (dimension or measure). With SCATTERN, there must be two measures for the axes, and the sort field represents the points plotted. |
color |
|
GRMULTIGRAPH sort field |
page |
Example: Converting a SCATTERN Chart Request to Chart Attribute Syntax
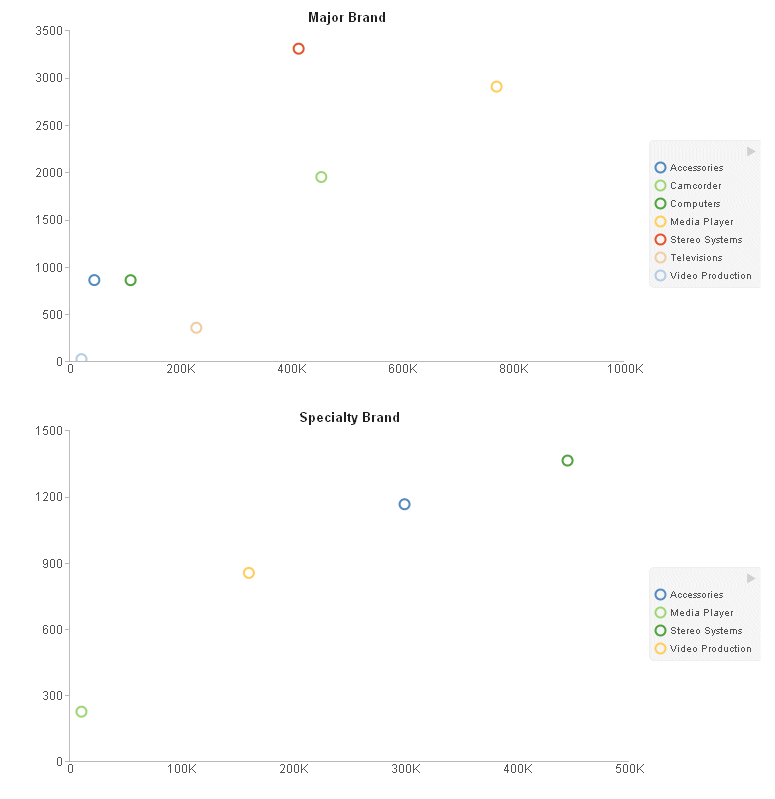
The following example generates multiple scatter charts using traditional syntax (LOOKGRAPH value is SCATTERN). The high-level sort field (BRANDTYPE) is the GRMULTIGRAPH sort field. Separate scatter charts are generated for each value of BRANDTYPE. The PRODUCT_CATEGORY sort field is the GRLEGEND sort field:
GRAPH FILE WF_RETAIL_LITE
HEADING CENTER
"<BRANDTYPE"
SUM COGS_US
QUANTITY_SOLD
BY BRANDTYPE
BY PRODUCT_CATEGORY
ON GRAPH SET EMBEDHEADING ON
ON GRAPH PCHOLD FORMAT JSCHART
ON GRAPH SET LOOKGRAPH SCATTERN
ON GRAPH SET GRMERGE ADVANCED
ON GRAPH SET GRMULTIGRAPH 1
ON GRAPH SET GRLEGEND 1
ON GRAPH SET GRXAXIS 0
ON GRAPH SET STYLE *
INCLUDE=IBFS:/FILE/IBI_HTML_DIR/javaassist/intl/EN/combine_templates/ENWarm.sty,$
ENDSTYLE
END
The output is shown in the following image:
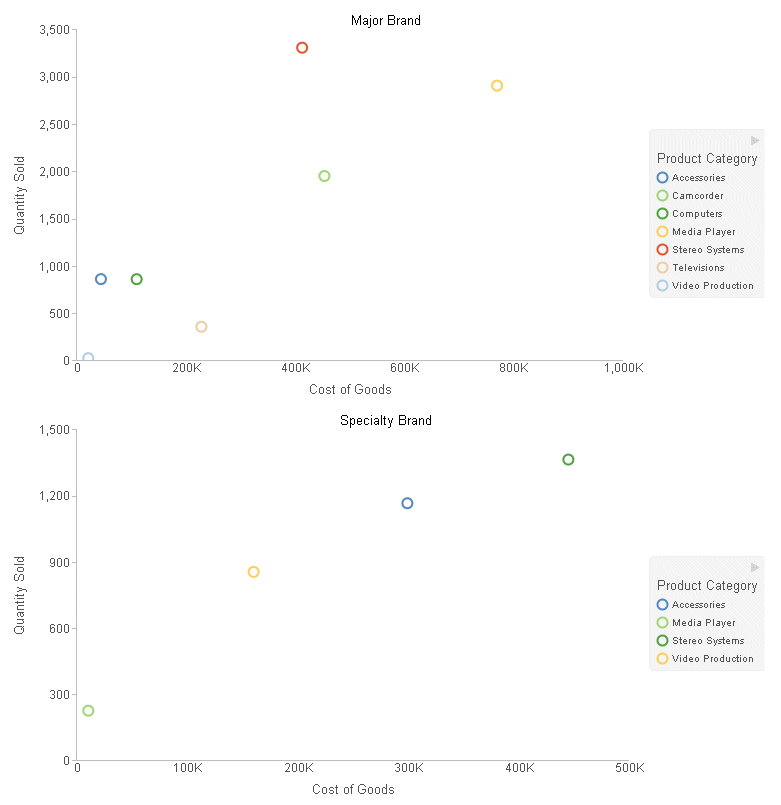
The following is the same request converted to chart attribute syntax. The LOOKGRAPH value is SCATTER. The measures (COGS_US and QUANTITY_SOLD) are assigned to the x-axis and y-axis attribute categories, the high-level sort field (BRANDTYPE) is assigned to the page attribute category, and the low-level sort field (PRODUCT_CATEGORY) is assigned to the color attribute category.
GRAPH FILE WF_RETAIL_LITE
HEADING CENTER
"<BRANDTYPE "
SUM COGS_US QUANTITY_SOLD
BY BRANDTYPE
BY PRODUCT_CATEGORY
ON GRAPH SET EMBEDHEADING ON
ON GRAPH PCHOLD FORMAT JSCHART
ON GRAPH SET LOOKGRAPH SCATTER
ON GRAPH SET STYLE *
INCLUDE=IBFS:/FILE/IBI_HTML_DIR/javaassist/intl/EN/combine_templates/ENWarm.sty,$
TYPE=DATA, COLUMN=QUANTITY_SOLD, BUCKET=y-axis,$
TYPE=DATA, COLUMN=COGS_US, BUCKET=x-axis,$
TYPE=DATA, COLUMN=BRANDTYPE, BUCKET=page,$
TYPE=DATA, COLUMN=PRODUCT_CATEGORY, BUCKET=color,$
END
The output is shown in the following image:
Reference: Attribute Category Assignments for SCATTERS Charts
Charts with LOOKGRAPH SCATTERS can have any number of measures to be plotted on the y-axis, and the sort field becomes the x-axis. However, chart attribute syntax supports only one y-axis measure.
Note: Merge parameters are not supported with LOOKGRAPH SCATTERS.
The following table lists the attribute category conversions for SCATTERS charts.
|
Type of Column or Parameter |
Attribute Category |
|---|---|
|
Measure field (any number). |
y-axis Only one measure supported on the y-axis. |
|
Sort field (measure or dimension). With SCATTERS, the sort field becomes the x-axis. |
x-axis |
|
High-level sort field. |
page |
Example: Converting a SCATTERS Chart Request to Chart Attribute Syntax
The following example generates multiple scatter charts using traditional syntax (LOOKGRAPH value is SCATTERS). The high-level sort field (BRANDTYPE) is the sort field that generates multiple charts. The QUANTITY_SOLD sort field represents the x-axis. The measure COGS_US is plotted on the y-axis:
GRAPH FILE WF_RETAIL_LITE
HEADING CENTER
"<BRANDTYPE"
SUM COGS_US
BY BRANDTYPE
BY QUANTITY_SOLD
ON GRAPH SET EMBEDHEADING ON
ON GRAPH PCHOLD FORMAT JSCHART
ON GRAPH SET LOOKGRAPH SCATTERS
ON GRAPH SET STYLE *
INCLUDE=IBFS:/FILE/IBI_HTML_DIR/javaassist/intl/EN/combine_templates/ENWarm.sty,$
ENDSTYLE
END
The output is shown in the following image:
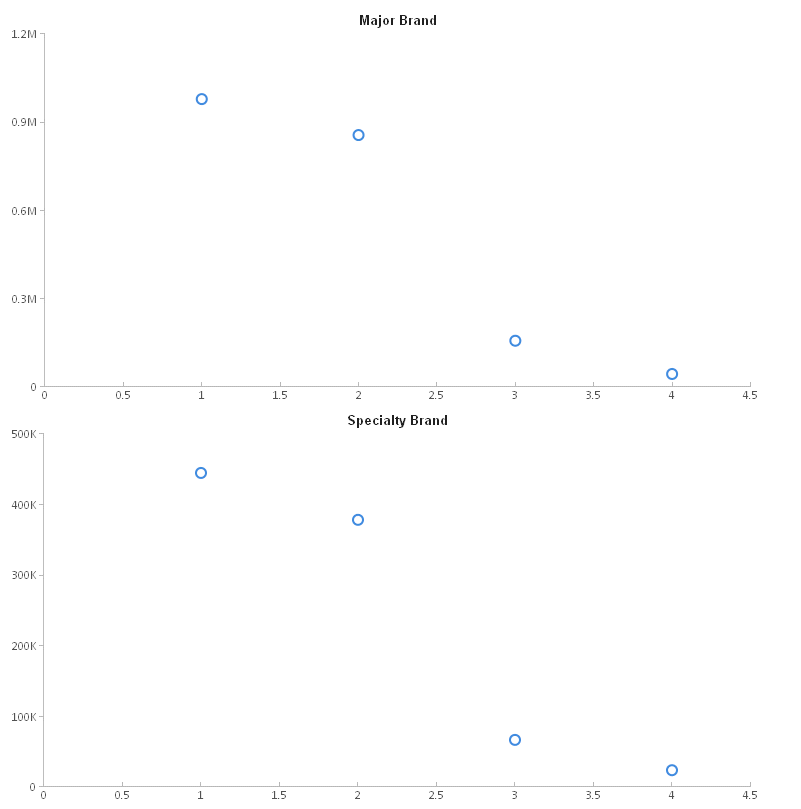
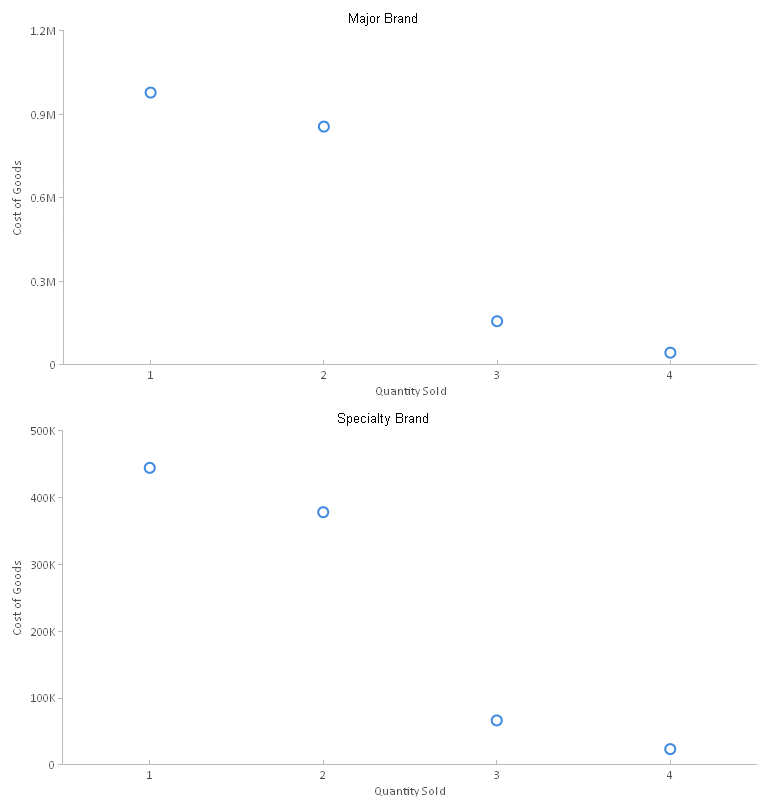
The following is the same request converted to chart attribute syntax. The LOOKGRAPH value is SCATTER. The measure (COGS_US) is assigned to the y-axis attribute category, the low-level sort field QUANTITY_SOLD is assigned to the x-axis attribute category, and the high-level sort field (BRANDTYPE) is assigned to the page attribute category:
GRAPH FILE WF_RETAIL_LITE
HEADING CENTER
"<BRANDTYPE"
SUM COGS_US
BY BRANDTYPE
BY QUANTITY_SOLD
ON GRAPH SET EMBEDHEADING ON
ON GRAPH PCHOLD FORMAT JSCHART
ON GRAPH SET LOOKGRAPH SCATTER
ON GRAPH SET STYLE *
type=data, column=cogs_us, bucket=y-axis,$
type=data, column=quantity_sold, bucket=x-axis,$
type=data, column=brandtype, bucket=page,$
INCLUDE=IBFS:/FILE/IBI_HTML_DIR/javaassist/intl/EN/combine_templates/ENWarm.sty,$
ENDSTYLE
END
The output is shown in the following image:
| WebFOCUS | |
|
Feedback |