Converting Funnel Chart Requests to Chart Attribute Syntax
|
Reference: |
Funnel charts slice a measure based on a sort field. The defaults for several properties vary depending on whether the request uses traditional WebFOCUS syntax, chart attribute syntax, or a StyleSheet.
Reference: LOOKGRAPH Conversions for Funnel Charts
The following table lists the traditional LOOKGRAPH values and the new LOOKGRAPH values along with additional properties that may be needed for the chart type.
|
LOOKGRAPH Parameter |
|
|---|---|
|
Traditional |
Convert to |
|
FUNNEL |
FUNNEL |
Reference: Attribute Category Assignments for Funnel Charts
The following table lists the attribute category conversions for funnel charts.
|
Type of Column or Parameter |
Attribute Category |
|---|---|
|
measure field |
measure |
|
Either GRLEGEND or GRXAXIS sort field (only 1 is supported) |
color |
|
GRMULTIGRAPH sort field |
page |
Example: Converting a Funnel Chart Request to Chart Attribute Syntax
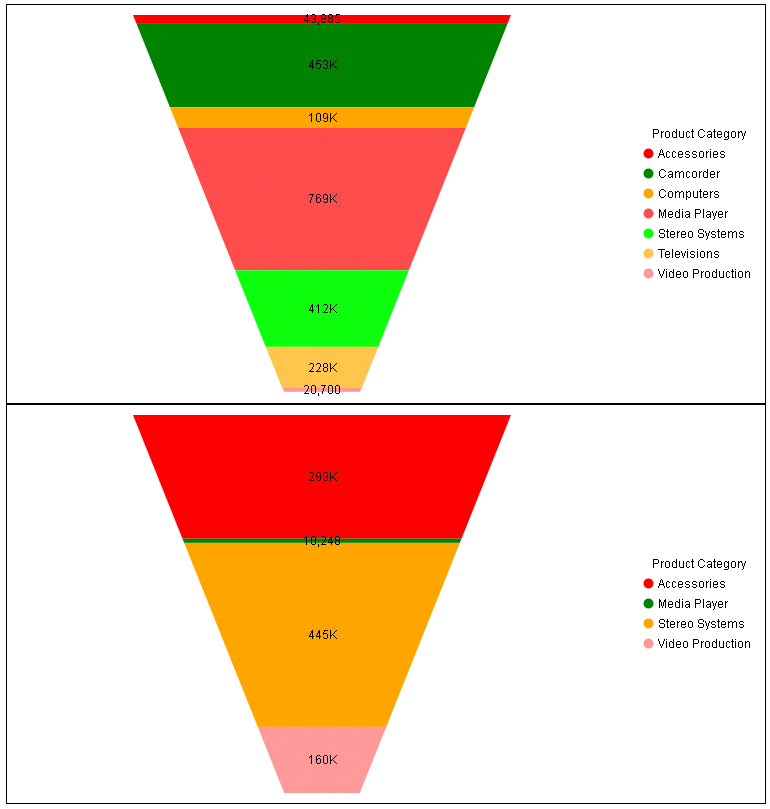
The following example generates a funnel chart using traditional syntax (LOOKGRAPH value is FUNNEL). Separate funnel charts are generated for each value of BRANDTYPE. The PRODUCT_CATEGORY sort field is the GRLEGEND sort field:
GRAPH FILE WF_RETAIL_LITE
SUM COGS_US
BY BRANDTYPE
BY PRODUCT_CATEGORY
ON GRAPH PCHOLD FORMAT JSCHART
ON GRAPH SET GRMERGE ADVANCED
ON GRAPH SET GRMULTIGRAPH 1
ON GRAPH SET GRLEGEND 1
ON GRAPH SET GRXAXIS 0
ON GRAPH SET LOOKGRAPH FUNNEL
ON GRAPH SET AUTOFIT ON
END
The output is shown in the following image:

The following is the same request converted to chart attribute syntax. The LOOKGRAPH value is FUNNEL. The measure (COGS_US) is assigned to the measure attribute category, the high-level sort field (BRANDTYPE) is assigned to the page attribute category, and the low-level sort field (PRODUCT_CATEGORY) is assigned to the color attribute category. Some of the default properties, such as the colors and generation of data text labels, are different from the defaults for the traditional syntax.
GRAPH FILE WF_RETAIL_LITE
SUM COGS_US
BY BRANDTYPE
BY PRODUCT_CATEGORY
ON GRAPH PCHOLD FORMAT JSCHART
ON GRAPH SET LOOKGRAPH FUNNEL
ON GRAPH SET AUTOFIT ON
ON GRAPH SET STYLE *
type=data, column=cogs_us, bucket=measure,$
type=data, column=brandtype, bucket=page,$
type=data, column=product_category, bucket=color,$
ENDSTYLE
END
The output is shown in the following image:

| WebFOCUS | |
|
Feedback |