Converting Boxplot Requests to Chart Attribute Syntax
|
Reference: |
A boxplot shows data broken into quartiles. In a boxplot, each series and group requires five values in order to visualize this breakdown.
With traditional syntax, the measures need to be in ascending order so that they can be assigned to the correct quartile. With chart attribute syntax, the category assignments make this requirement not necessary.
Reference: LOOKGRAPH Conversions for Boxplots
The following table lists the traditional LOOKGRAPH values and the new LOOKGRAPH values along with additional properties that may be needed for the chart type.
|
LOOKGRAPH Parameter |
|
|---|---|
|
Traditional |
Convert to |
|
BOXPLOT |
BOXPLOT |
Reference: Attribute Category Assignments for Boxplots
The following table lists the attribute category conversions for boxplots.
|
Type of Column or Parameter |
Attribute Category |
|---|---|
|
low value measure field |
min |
|
box bottom measure field |
lower |
|
median measure field |
median |
|
box top measure field |
upper |
|
high value measure field |
max |
|
sort field |
x-axis |
Note: Merge parameters are not supported with boxplots.
Example: Converting a Boxplot Request to Chart Attribute Syntax
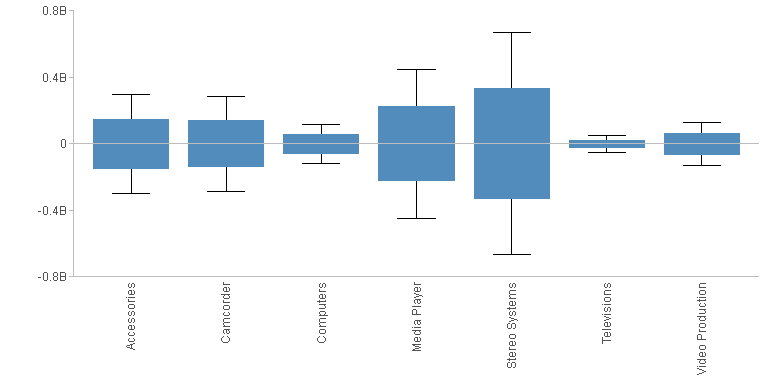
The following request generates a boxplot.
DEFINE FILE WF_RETAIL_LITE
DIFF1 = COGS_US -100000;
DIFF2 = COGS_US -200000;
DIFF3 = COGS_US +100000;
DIFF4 = COGS_US +200000;
END
GRAPH FILE WF_RETAIL_LITE
SUM DIFF1 DIFF2 MDN.COGS_US DIFF3 DIFF4
BY PRODUCT_CATEGORY
ON GRAPH PCHOLD FORMAT JSCHART
ON GRAPH SET LOOKGRAPH BOXPLOT
ON GRAPH SET STYLE *
INCLUDE=IBFS:/FILE/IBI_HTML_DIR/javaassist/intl/EN/combine_templates/ENWarm.sty,$
*GRAPH_JS
"boxplotProperties": {"drawHatAsBox": false}
*END
ENDSTYLE
END
The output is shown in the following image.

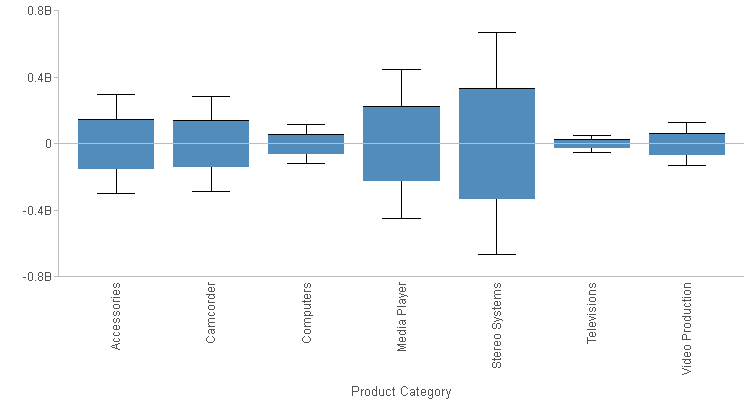
The following version of the request uses chart attribute syntax.
DEFINE FILE WF_RETAIL_LITE
DIFF1 = COGS_US -100000;
DIFF2 = COGS_US -200000;
DIFF3 = COGS_US +100000;
DIFF4 = COGS_US +200000;
END
GRAPH FILE WF_RETAIL_LITE
SUM DIFF1 DIFF2 MDN.COGS_US DIFF3 DIFF4
BY PRODUCT_CATEGORY
ON GRAPH PCHOLD FORMAT JSCHART
ON GRAPH SET LOOKGRAPH BOXPLOT
ON GRAPH SET STYLE *
type=data, column=product_category, bucket=x-axis,$
type=data, column=diff2, bucket=min,$
type=data, column=diff1, bucket=lower,$
type=data, column=C4, bucket=median,$
type=data, column=diff3, bucket=upper,$
type=data, column=diff4, bucket=max,$
INCLUDE=IBFS:/FILE/IBI_HTML_DIR/javaassist/intl/EN/combine_templates/ENWarm.sty,$
*GRAPH_JS
"boxplotProperties": {"drawHatAsBox": false}
*END
ENDSTYLE
END
The output is shown in the following image.

| WebFOCUS | |
|
Feedback |