ViewableSeriesStock
This property selects the number of series to be made visible in a stock graph.
Syntax:
setViewableSeriesStock(value);
value = getViewableSeriesStock();
where:
- value
-
Is any integer between 0 and the number of series in the data that defines the graph. 0 (show all series) is the default value.
Example:
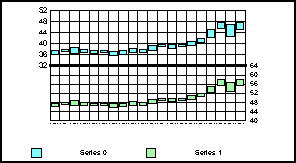
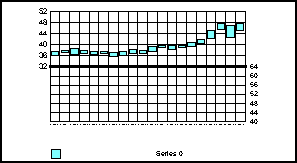
setGraphType(73); setViewableSeriesStock(2);
setViewableSeriesStock(1);
Note:
- This property does not apply to the following graph types: Open-Hi-Lo-Close Candle Stock Graph (Graph Type = 71), Open-Hi-Lo-Close Candle Stock Graph with Volume (Graph Type = 72), and Candle Stock Hi-Lo Open-Close Graph with Volume (Graph Type = 84).
- The setDataRange() method can also be used to set the number of series to be made visible in a graph. It establishes the range of data that is used in a graph.
See ScrollOffsetSeries, ViewableGroupsStock, setDataRange().
| WebFOCUS | |
|
Feedback |