Grouping Tables and Components in a PowerPoint Slide
|
How to: |
When table elements are placed on a PowerPoint slide, the elements are placed in individual text boxes to allow for explicit positioning to match the other positioned drivers, such as PDF and DHTML.
The PPTXGROUP parameter enables you to group elements together in a PPTX report. You can rotate, flip, move, or resize objects within a group at the same time as though they were a single object. You can also change the attributes of all of the objects in a group at one time, including font, color, or size, and you can ungroup a group of objects at any time, and then regroup them later.
In WebFOCUS, grouping is done within each report component. Objects within the report component (or stand-alone report), including data, all headings and footings, and images, are grouped together. In compound reports, each component report is grouped individually and non-component elements, such as drawing objects, lines, and images, are not included in any group.
Syntax: How to Group Tables and Components in a PowerPoint Slide
SET PPTXGROUP = {ON|OFF}The command can also be issued from within a report using:
ON TABLE SET PPTXGROUP = {ON|OFF}In a StyleSheet:
TYPE=REPORT, PPTXGROUP = {ON|OFF}where:
- ON
-
Enables you to group elements together in a PPTX report.
- OFF
-
Indicates no grouping of elements, which is the legacy behavior. OFF is the default value.
Example: Displaying Group Tables and Components in a Standard Report
In the following standard report (not Compound), the grouping is defined for the core report elements, excluding images and drawing objects, defined at the TYPE=REPORT level.
TABLE FILE GGSALES
SUM DOLLARS/D12CM UNITS/D12C BUDDOLLARS/D12CM BUDUNITS/D12C
COMPUTE SHOWCAT/A100=CATEGORY||'.GIF';
BY REGION
BY CATEGORY
ON TABLE SUBHEAD
"Report Heading Here"
" "
" "
" "
HEADING
"Page Heading here"
FOOTING
"Page Footing here"
ON TABLE SUBFOOT
"Report Footing Here"
ON TABLE PCHOLD AS GROUPTEST FORMAT PPTX
ON TABLE SET STYLE *
TYPE=REPORT, PPTXGROUP = ON, SQUEEZE=ON, FONT=TAHOMA,SIZE=12, ORIENTATION=LANDSCAPE, $
TYPE=REPORT, OBJECT=LINE, POSITION=(9 1), DIMENSION=(1 5), COLOR=BLUE, $
TYPE=REPORT, IMAGE=IBILOGO, POSITION=(0 0), $
TYPE=TABHEADING, IMAGE=GGLOGO.GIF, POSITION=(6.5 .10), $
TYPE=DATA,COLUMN=SHOWCAT, IMAGE=(SHOWCAT), PRESERVERATIO=ON,
SIZE=(.5 .5), $
END
The output is:

Example: Displaying Group Tables and Components in a Compound Report
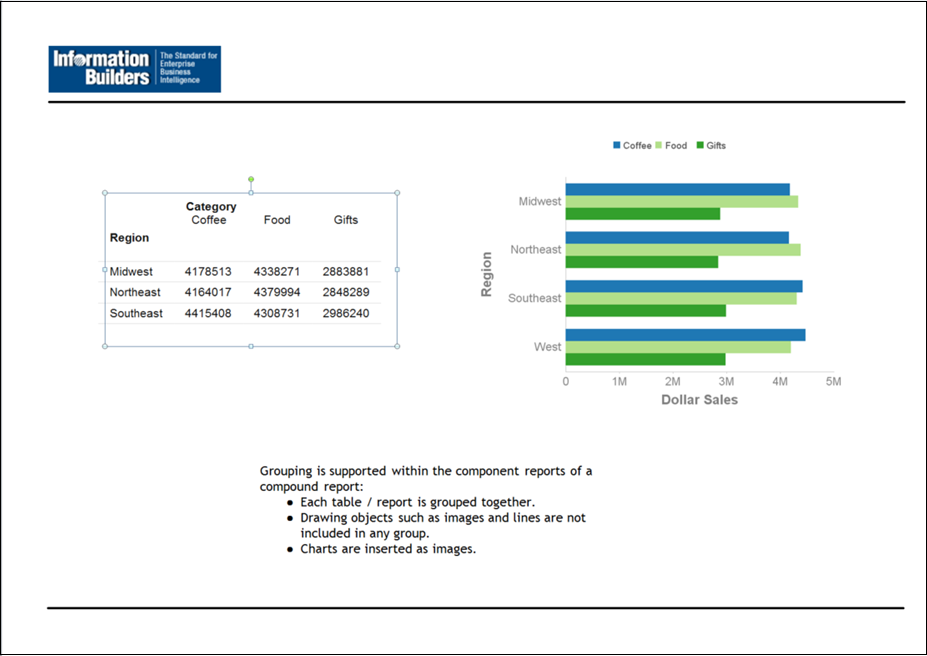
In the following compound report, the grouping is defined for the component report. Additional objects on the page, including the chart image, logo image, lines, and text box are not included in the grouping.
SET HTMLARCHIVE=ON
SET PPTXGRAPHTYPE=PNG
SET PPTXGROUP=ON
COMPOUND LAYOUT PCHOLD FORMAT PPTX
UNITS=IN, $
SECTION=section1, LAYOUT=ON, MERGE=OFF, ORIENTATION=LANDSCAPE, PAGESIZE=PPT Slide, $
PAGELAYOUT=1, NAME='Page layout 1', TEXT='Page layout 1', BOTTOMMARGIN=0.5, TOPMARGIN=0.5, $
OBJECT=STRING, NAME='text1', TEXT='<left>Grouping is supported within the component reports of a compound report:
<ul type=disc>
<LI>Each table / report is grouped together. </LI>
<LI>Drawing objects such as images and lines are not included in any group. </LI>
<LI>Charts are inserted as images.</LI></ul><div><br></div><br></left>',
POSITION=(2.764 4.958), MARKUP=ON, WRAP=ON, DIMENSION=(4.000 1.992), FONT='TREBUCHET MS', COLOR=RGB(0 0 0), SIZE=10, $
COMPONENT='report1', TEXT='report1', POSITION=(1.028 2.083), DIMENSION=(4.431 1.667), $
COMPONENT='chart2', TEXT='chart2', POSITION=(4.972 1.319), DIMENSION=(4.456 3.085), COMPONENT-TYPE=GRAPH, $
OBJECT=BOX, NAME='line1', POSITION=(0.498 6.500),
DIMENSION=(9.167 0.022), BACKCOLOR=BLACK, BORDER-COLOR=BLACK, $
OBJECT=BOX, NAME='line2', POSITION=(0.502 1.097),
DIMENSION=(9.167 0.022), BACKCOLOR=BLACK, BORDER-COLOR=BLACK, $
OBJECT=IMAGE, NAME='image4', IMAGE=ibologo.gif, ALT='',
POSITION=(0.502 0.499), DIMENSION=(1.861 0.506), $
END
SET COMPONENT='report1'
TABLE FILE GGSALES
SUM
   GGSALES.SALES01.DOLLARS
BY GGSALES.SALES01.REGION
ACROSS LOWEST GGSALES.SALES01.CATEGORY
ON TABLE SET PAGE-NUM NOLEAD
ON TABLE NOTOTAL
ON TABLE PCHOLD FORMAT PPTX
ON TABLE SET STYLE *
     INCLUDE=IBFS:/FILE/IBI_HTML_DIR/ibi_themes/Warm.sty,$
$
ENDSTYLE
END
SET COMPONENT='chart2' SET PAGE-NUM=NOLEAD SET ARGRAPHENGINE=JSCHART SET EMBEDHEADING=ON SET GRAPHDEFAULT=OFF GRAPH FILE GGSALES SUM GGSALES.SALES01.DOLLARS BY GGSALES.SALES01.CATEGORY ACROSS GGSALES.SALES01.REGION ON GRAPH PCHOLD FORMAT HTML ON GRAPH SET VZERO OFF ON GRAPH SET GRWIDTH 1 ON GRAPH SET UNITS 'PIXELS' ON GRAPH SET HAXIS 770.0 ON GRAPH SET VAXIS 405.0 ON GRAPH SET GRMERGE ADVANCED ON GRAPH SET GRMULTIGRAPH 0 ON GRAPH SET GRLEGEND 1 ON GRAPH SET GRXAXIS 1 ON GRAPH SET LOOKGRAPH HBAR ON GRAPH SET STYLE *
*GRAPH_SCRIPT
setPieDepth(0);
setPieTilt(0);
setDepthRadius(0);
setCurveFitEquationDisplay(false);
setPlace(true);
*END
INCLUDE=IBFS:/FILE/IBI_HTML_DIR/ibi_themes/Warm.sty,$
TYPE=REPORT, TITLETEXT='WebFOCUS Report', $
*GRAPH_SCRIPT
setLegendPosition(4);
*GRAPH_JS_FINAL
"blaProperties": {
    "orientation": "horizontal"
},
"agnosticSettings": {
    "chartTypeFullName": "Bar_Clustered_Horizontal"
}
*END
ENDSTYLE
END
-RUN

COMPOUND END
The output is:
| WebFOCUS | |
|
Feedback |