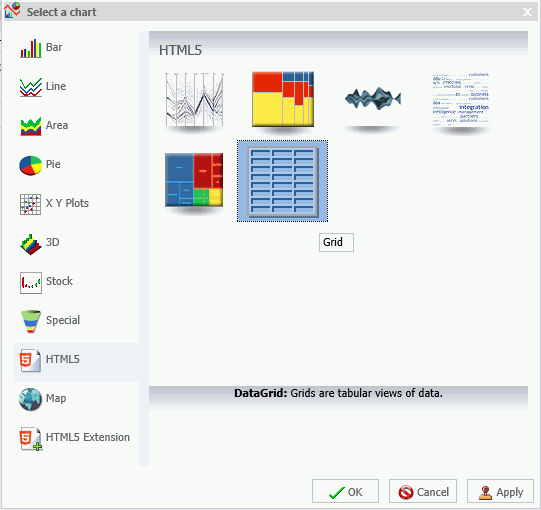
Grid Added as a New Chart Type
The ability to create a Grid chart type has been added. Accessible from the Other button on the Format tab in Chart mode, the Grid feature is part of the HTML5 group of charts.
Grids allow you to display data in tabular format. As a new chart type, you can now display your data in a format that is similar to that of a typical report, as shown in the following image.

Note: Grids are also available in Visualization mode.
| WebFOCUS | |
|
Feedback |