Binning Values in a Histogram
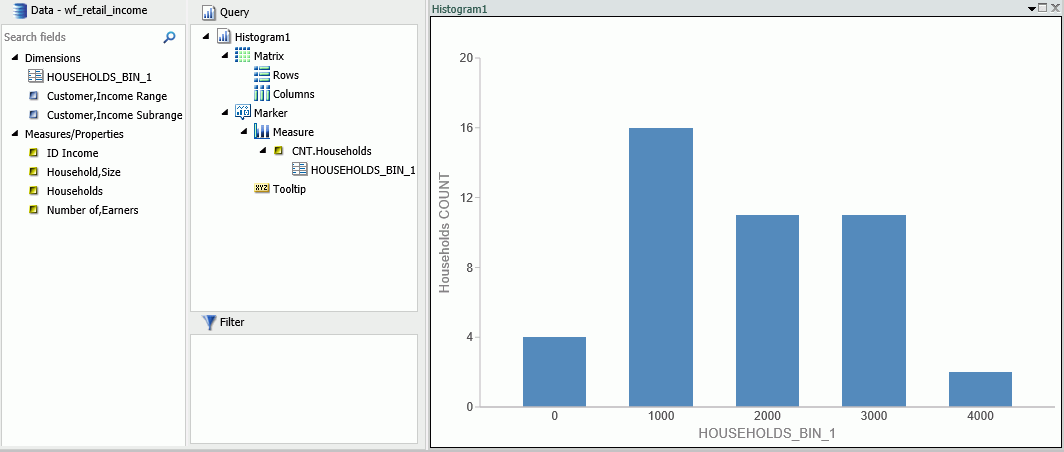
You can now create Histograms in Visualization mode. Histograms graphically represent the distribution of numeric data. They facilitate the identification and discovery of the underlying frequency distribution within a set of continuous data. You can use histograms to identify trends and illustrate categorizations, or groupings, also known as bins.
Binning is available in Chart and Visualization mode. Adding a measure to a histogram automatically creates bins with a default width of 10. This bin value is designated as a dimension field, since it is a limited field with a discrete set of possible values that was created from a field with an unlimited, continuous range of values. The measure displays as a count (.CNT) field and the related bin is created in the Query pane. You can right-click this bin field and click Edit Bins to change the value that dictates the width or format of the contents of the bin.
The bin automatically displays in the Query pane, as well as the under the Dimension group in the Data pane, as shown in the following image.

| WebFOCUS | |
|
Feedback |