Binning
Binning enables you to determine the frequency of values across a bin or grouping, as defined by a subset of values. With binning, you can create discrete buckets of continuous data that control how groups of your data display. In addition, binning gives you the ability to review trends and spot outliers.
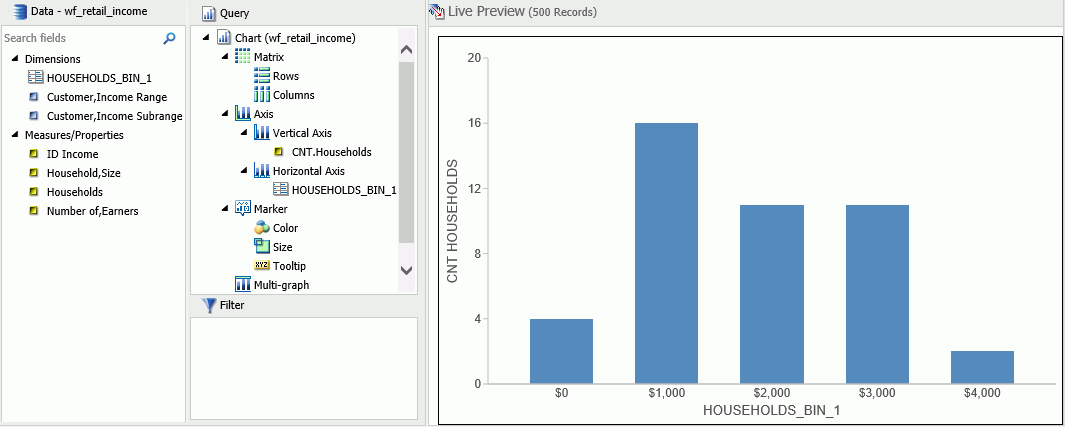
For example, you can review the range of expenses incurred by households. In the following example, these ranges are represented by bins that are grouped by $1000. In this case, you can see that the largest number of households had the smallest expense (16) while the trend declines as the bin size gets larger. With binning, you can see the frequency of values across the different groupings, as shown in the following image.

| WebFOCUS | |
|
Feedback |