Using the Chart Template Engine to Customize Tooltips and Data Labels
|
Reference: |
A template is a special string of characters that the chart engine will dynamically replace with chart component information when it renders the chart. A template is made up of macros. Macros are strings enclosed in a double set of curly braces. Each macro is parsed and replaced independently to build a final string. The chart engine includes many pre-defined macros.
Macros can be parameterized. Parameters are a comma-separated list of strings, delimited with parentheses. The built in row_label and col_label macros are parameterized, so you can choose which row or column label to include. The first row is row zero (0). For example:
{{row_label(0)}}Some macros apply to chart attribute syntax. For information about chart attribute syntax, see WebFOCUS Chart Attribute Syntax.
When defining custom data text labels, you can use template macros to display chart component information.
Since data text labels are automatically populated with default values, you need to include the following properties to clear out the default formatting and you must place the custom dataLabels in a GRAPH_JS_FINAL block in the StyleSheet.
"dataLabels": {"visible":true,"formatCallback": null, "displayMode": null}Reference: Template Macros
The following lists the pre-defined macros for the chart template engine:
|
Macro |
Definition |
|---|---|
|
auto_tooltip_content |
Automatically generated tooltip text |
|
col_id |
Column number in a matrix chart |
|
col_label |
Column label in a matrix chart |
|
coloraxis_title |
|
|
data_page_slider_current_index |
Index position of the slider |
|
data_page_slider_current_label |
Label of the current slider position |
|
group_count |
Number of groups |
|
group_id |
Group number |
|
group_label |
Group label |
|
group_percent |
Percent for each series within the group |
|
group_sum |
Series sum for current group |
|
misc_id |
|
|
nested_label |
Group label |
|
object_id |
|
|
row_id |
Row number in a matrix chart |
|
row_label |
Row label in a matrix chart |
|
series_count |
Number of series in the request |
|
series_id |
Series number |
|
series_label |
Series label |
|
series_percent |
Percent of current series within all groups. |
|
series_sum |
Sum of current series for all groups. |
|
tooltipn |
The nth field in the tooltip attribute category. |
|
value |
The value represented by the series when using chart attribute syntax. |
|
xaxis_title |
x-axis title |
|
yaxis_title |
y-axis title |
|
zaxis_title |
z-axis title |
Example: Using the Template Engine in Tooltips
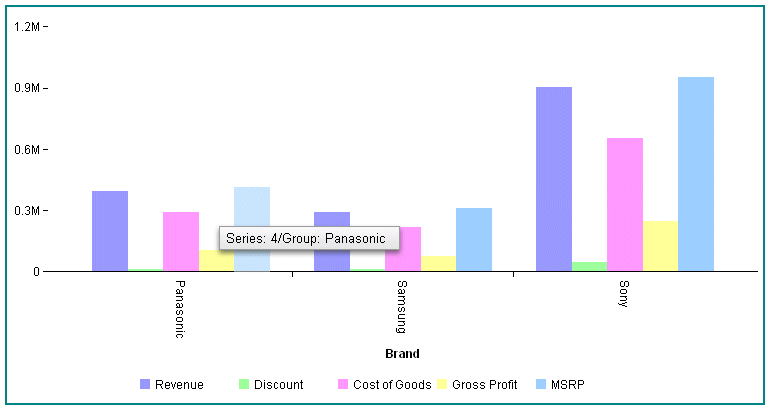
The following request generates tooltips that contain the series id and the group label:
GRAPH FILE WF_RETAIL_LITE
SUM REVENUE_US DISCOUNT_US COGS_US GROSS_PROFIT_US MSRP_US
BY BRAND
WHERE BRAND EQ 'Sony' OR 'Samsung' OR 'Panasonic'
ON GRAPH PCHOLD FORMAT JSCHART
ON GRAPH SET LOOKGRAPH VBAR
ON GRAPH SET STYLE *
*GRAPH_JS
"border": {"width": 2, "color": "teal"},
"series": [{"series": "reset",
	"tooltip": "Series: {{series_id}}/Group: {{group_label}}"}]
*END
ENDSTYLE
END
The tooltip for series 4 in group 0 is shown in the following image:

Note: If your request uses chart attribute syntax, you must put tooltip customization properties in a *GRAPH_JS_FINAL block in the WebFOCUS StyleSheet. For information about chart attribute syntax, see WebFOCUS Chart Attribute Syntax.
Example: Using a Template Macro in a Data Text Label
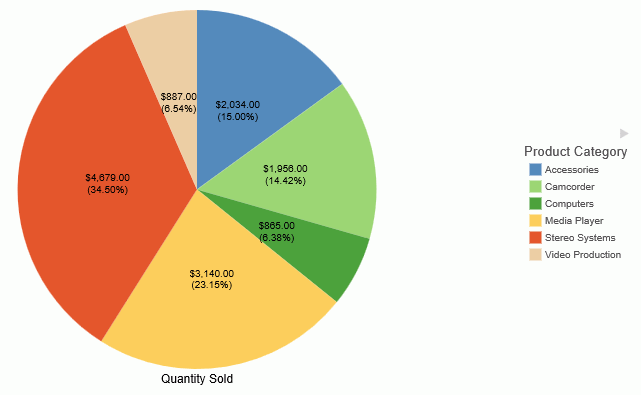
The following request generates a pie chart. The series data text labels display the sum of quantity sold as a number formatted with a dollar sign and two decimal places. It uses the HTML string \n to go to a new line and displays the percentage using the series_percent template macro.
GRAPH FILE WF_RETAIL_LITE
SUM QUANTITY_SOLD
BY PRODUCT_CATEGORY
WHERE PRODUCT_CATEGORY NE 'Televisions'
ON GRAPH PCHOLD FORMAT JSCHART
ON GRAPH SET LOOKGRAPH PIE
-*ON GRAPH SET AUTOFIT ON
ON GRAPH SET STYLE *
INCLUDE=IBFS:/FILE/IBI_HTML_DIR/ibi_themes/Warm.sty,$
TYPE=DATA, COLUMN=N1, BUCKET=color, $
TYPE=DATA, COLUMN=N2, BUCKET=measure, $
*GRAPH_JS_FINAL
"dataLabels": {"visible":true,"formatCallback": null, "displayMode": null},
"series":[{"series": "reset",
 "dataLabels":{"content":"{{value | formatNumber('$#,###.00')}}\n({{series_percent}})"}}],
*END
ENDSTYLE
END
The output is shown in the following image.

Example: Using a Template Macro in a Data Text Label for a Bar Chart
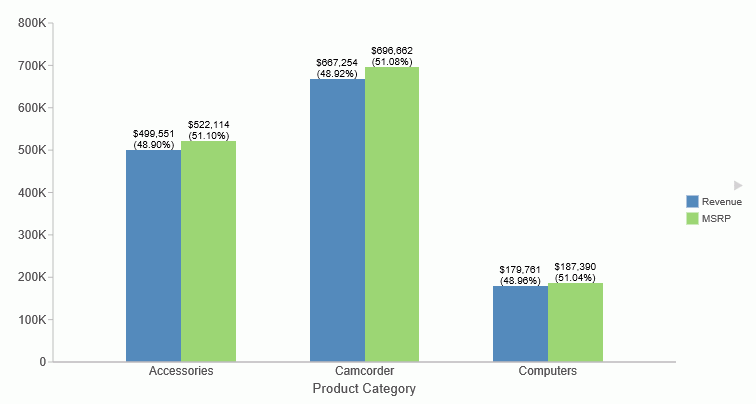
The following request generates a bar chart. The series data text labels display the revenue and MSRP as numbers formatted with a dollar sign and no decimal places. It uses the HTML string \n to go to a new line and displays the percent of each series within its group using the group_percent template macro.
GRAPH FILE WF_RETAIL_LITE
SUM REVENUE_US MSRP_US
BY PRODUCT_CATEGORY
WHERE PRODUCT_CATEGORY EQ 'Accessories' OR 'Computers' OR 'Camcorder'
ON GRAPH PCHOLD FORMAT JSCHART
ON GRAPH SET LOOKGRAPH BAR
ON GRAPH SET STYLE *
INCLUDE=IBFS:/FILE/IBI_HTML_DIR/ibi_themes/Warm.sty,$
TYPE=DATA, COLUMN=N1, BUCKET=x-axis, $
TYPE=DATA, COLUMN=N2, BUCKET=y-axis, $
TYPE=DATA, COLUMN=N3, BUCKET=y-axis, $
*GRAPH_JS_FINAL
"dataLabels": {"visible":true,"formatCallback": null, "displayMode": null},
"series":[{"series": "reset",
 "dataLabels":{"content":"{{value | formatNumber('$#,###')}}\n({{group_percent}})"}}],
*END
ENDSTYLE
END
The output is shown in the following image.

| WebFOCUS | |
|
Feedback |