Sorting Stacked Bar Chart Risers
|
How to: |
In a stacked bar chart, one riser represents the total value for all series in a group. You can use the axis sort property to sort these stacked risers in ascending or descending order of the numeric axis values.
Syntax: How to Sort Stacked Bar Chart Risers
"axisname": {"sort": {"order": "string", "by": "string"}}where:
- "axisname"
-
Is the axis along which the sorted risers will be drawn. Valid values are:
- xaxis
- yaxis
- zaxis
- "sort"
-
Defines the sort properties.
- "order": "string"
-
Defines how the risers will be sorted. Valid values are:
- "ascending"
- "descending"
The default is to not to sort the risers.
- "by": "string"
-
Defines the numeric axis that represents the values to be sorted. Valid values are:
- "x"
- "y"
- "z"
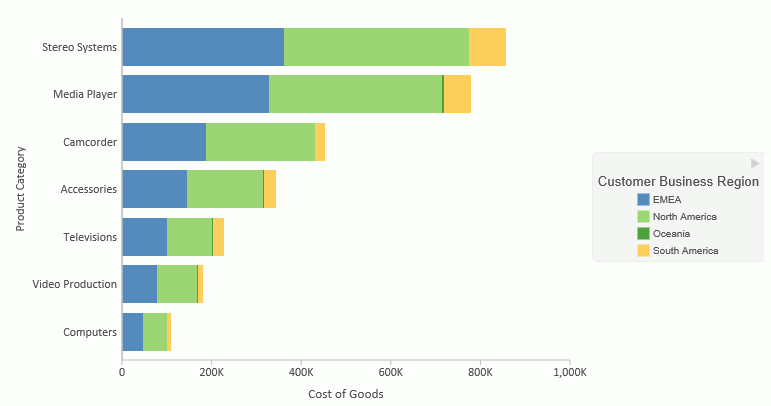
Example: Sorting Stacked Bar Chart Risers in Descending Order
The following request generates a horizontal stacked bar chart with the risers sorted along the x-axis in descending order of y-axis values.
GRAPH FILE WF_RETAIL_LITE
SUM COGS_US
BY BUSINESS_REGION
BY PRODUCT_CATEGORY
ON GRAPH PCHOLD FORMAT JSCHART
ON GRAPH SET LOOKGRAPH BAR
ON GRAPH SET STYLE *
INCLUDE=IBFS:/FILE/IBI_HTML_DIR/javaassist/intl/EN/combine_templates/ENWarm.sty,$
TYPE=REPORT, CHART-SERIES-LAYOUT=stacked, CHART-ORIENTATION=horizontal,$
TYPE=DATA, COLUMN=COGS_US, BUCKET=y-axis, $
TYPE=DATA, COLUMN=BUSINESS_REGION, BUCKET=color, $
TYPE=DATA, COLUMN=PRODUCT_CATEGORY, BUCKET=x-axis, $
*GRAPH_JS
"xaxis": {"sort": {"order": "descending", "by": "y"}},
*END
ENDSTYLE
END
The output is shown in the following image.
| WebFOCUS | |
|
Feedback |