Controlling Riser Width
|
How to: |
By default, the chart engine fits chart output to the size of the container. It generates a scroll bar when all of the risers will not fit in the container nicely. if the AUTOFIT parameter is set to RESIZE and the container is resized, the risers will also be resized.
Using the xaxis:groupFit properties, you can control riser width. You can set a minimum, maximum, or exact width for risers, or you can specify a minimum number of groups to show in the frame if a scroll bar is generated.
Syntax: How to Control Riser Width
"xaxis": {
 "groupFit":
   {"rule": "string",
      "value": value      }
   }
where:
- "rule": "string"
-
Is one of the following rules that controls how the riser widths are determined.
- "auto". Size risers according to the width of the chart frame. This is the default value.
- "minSize". Risers are at least value pixels wide.
- "maxSize". Risers are never more than value pixels wide.
- "exactSize". Risers are always exactly value pixels wide.
- "scrollCount". If the bars do not fit nicely, add a scroll bar but ensure that value number of risers are visible on the chart at the same time.
- "value": value
-
Is the width in pixels for "minSize", "maxSize", or "exactSize", or the number of groups for "scrollCount". It is ignored for "auto". The default value is undefined.
Example: Controlling Riser Width
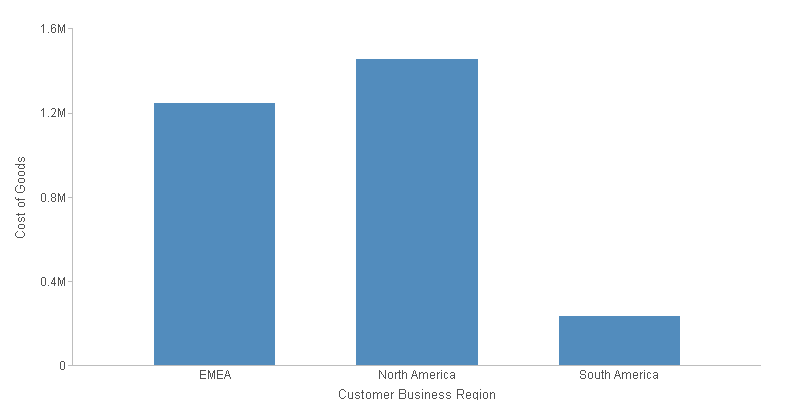
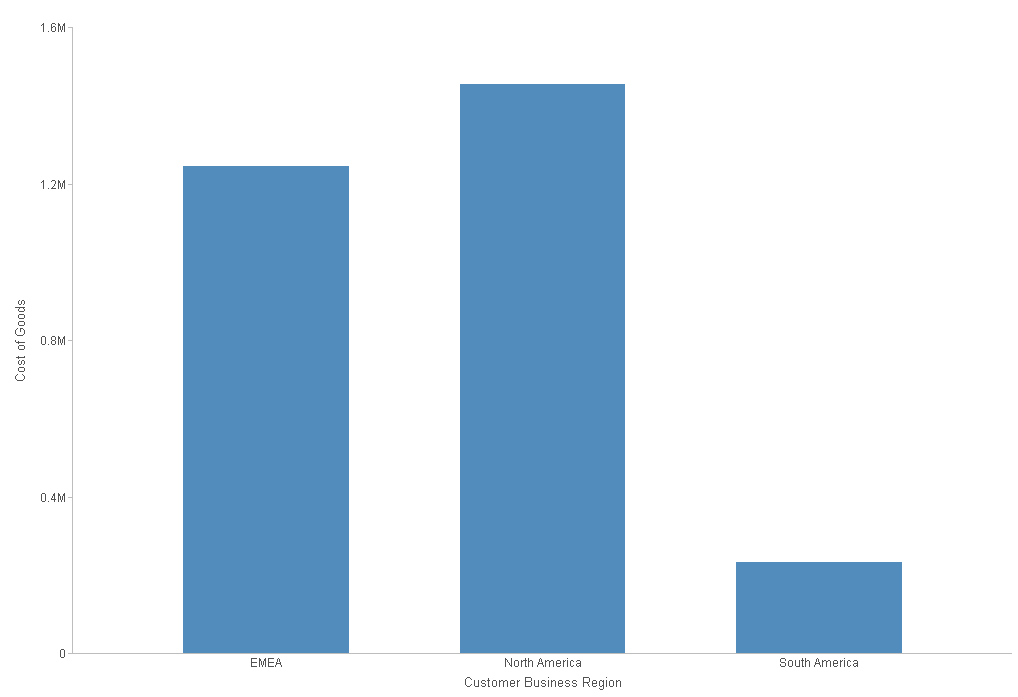
The following request generates a chart with risers that are sized automatically. The AUTOFIT parameter is set to RESIZE, so when the frame is resized, the riser widths are resized.
GRAPH FILE WF_RETAIL_LITE
SUM COGS_US
BY BUSINESS_REGION
WHERE BUSINESS_REGION NE 'Oceania'
ON GRAPH PCHOLD FORMAT JSCHART
ON GRAPH SET LOOKGRAPH BAR
ON GRAPH SET AUTOFIT RESIZE
ON GRAPH SET STYLE *
INCLUDE=IBFS:/FILE/IBI_HTML_DIR/javaassist/intl/EN/combine_templates/ENWarm.sty,$
TYPE=REPORT, CHART-SERIES-LAYOUT=side-by-side,$
TYPE=DATA, COLUMN=COGS_US, BUCKET=y-axis, $
TYPE=DATA, COLUMN=BUSINESS_REGION, BUCKET=x-axis, $
*END
ENDSTYLE
END
The initial chart display is shown in the following image.

The following image shows the same chart when the frame is resized to its maximum. The riser widths become wider to fill the chart frame.

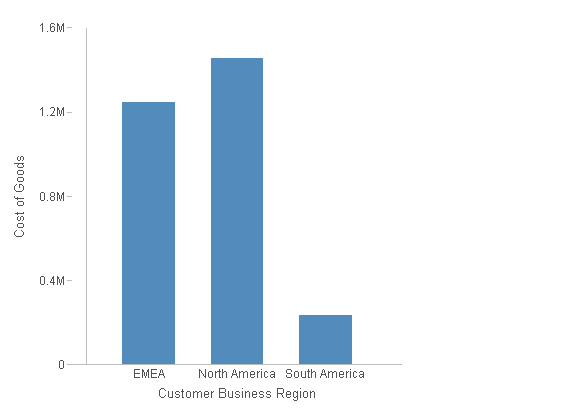
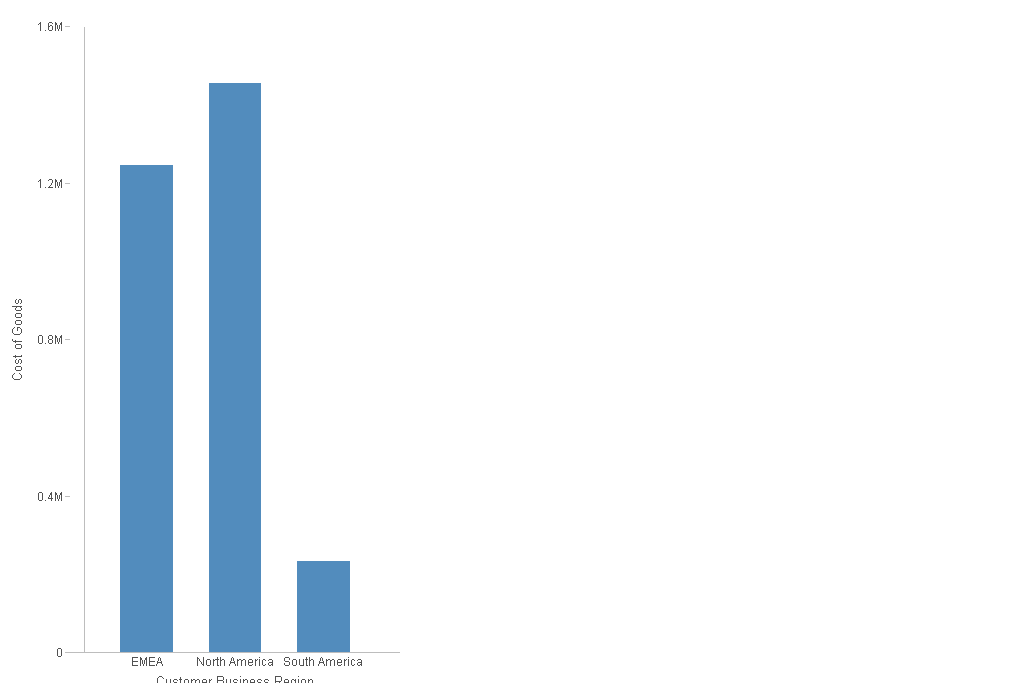
The following version of the request uses the groupFit properties to make the risers exactly 100 pixels wide.
GRAPH FILE WF_RETAIL_LITE
SUM COGS_US
BY BUSINESS_REGION
WHERE BUSINESS_REGION NE 'Oceania'
ON GRAPH PCHOLD FORMAT JSCHART
ON GRAPH SET LOOKGRAPH BAR
ON GRAPH SET AUTOFIT RESIZE
ON GRAPH SET STYLE *
INCLUDE=IBFS:/FILE/IBI_HTML_DIR/javaassist/intl/EN/combine_templates/ENWarm.sty,$
TYPE=REPORT, CHART-SERIES-LAYOUT=side-by-side,$
TYPE=DATA, COLUMN=COGS_US, BUCKET=y-axis, $
TYPE=DATA, COLUMN=BUSINESS_REGION, BUCKET=x-axis, $
*GRAPH_JS
"xaxis": {"groupFit": {
	"rule": "exactSize",
	"value": 100
	}}
*END
ENDSTYLE
END
The initial chart display is shown in the following image.

The following image shows the chart when the frame is resized to its maximum size. The risers are still the same width.

| WebFOCUS | |
|
Feedback |