Formatting an Axis Title
|
Topics: |
|
How to: |
The title properties control the content, visibility, and format of an axis title.
Syntax: How to Format an Axis Title
"axisname": {
  "title": {
    "text": "string",
    "visible": boolean,
    "font": "string",
    "color": "string",
    "position": "orthogonal"
}
}
where:
- "axisname"
-
Can be:
- "xaxis"
- "yaxis"
- "y2axis"
- "zaxis"
- "text": "string"
-
Is a string that defines axis title text. The default value for xaxis is the sort field name or title, or the name assigned with an AS phrase.
- "visible": boolean
-
Controls the visibility of the axis title. Valid values are:
- true, which makes the axis title visible.
- false, which makes the axis title not visible. This is the default value.
- "font": "string"
-
Is a string that defines the size, style, and typeface of the axis title. The default value for xaxis is 'bold 9pt Sans-Serif'.
- "color": "string"
-
Is a string that defines the color of the axis title using a color name or numeric specification string. The default value is "black".
For information about defining colors, see Colors and Gradients.
- "position": "orthogonal"
-
Applies to the y-axis and y2-axis. Places the title above and centered over the axis body line.
Example: Formatting the Axis Titles
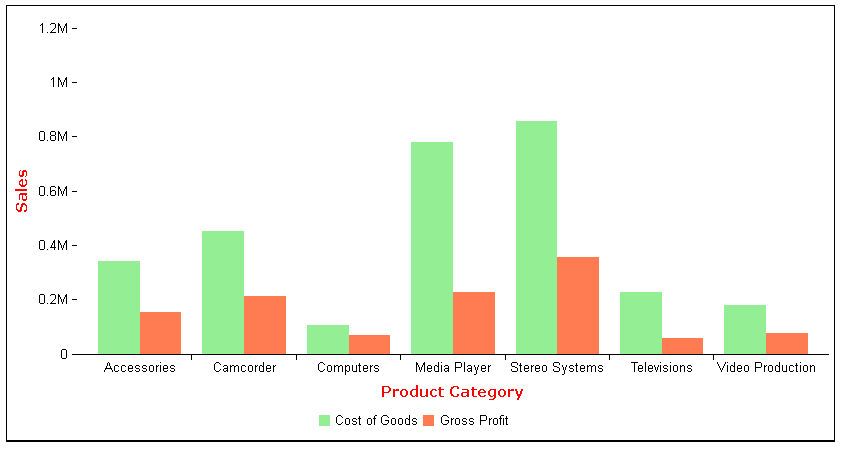
The following request makes the axis titles visible and red. It changes the font for the axis titles to bold 10pt Verdana:
GRAPH FILE WF_RETAIL_LITE
SUM COGS_US GROSS_PROFIT_US
ACROSS PRODUCT_CATEGORY
ON GRAPH PCHOLD FORMAT JSCHART
ON GRAPH SET LOOKGRAPH VBAR
ON GRAPH SET STYLE *
*GRAPH_JS
"xaxis": {"title": {
	"visible": true, "color": "red", "font": "bold 10pt Verdana"}},
"yaxis": {"title": {
	"visible": true, "color": "red", "font": "bold 10pt Verdana", "text": "Sales"}},
"series": [
	{"series": 0, "color": "lightgreen"},
	{"series": 1, "color": "coral"}]
*END
ENDSTYLE
END
The output is:
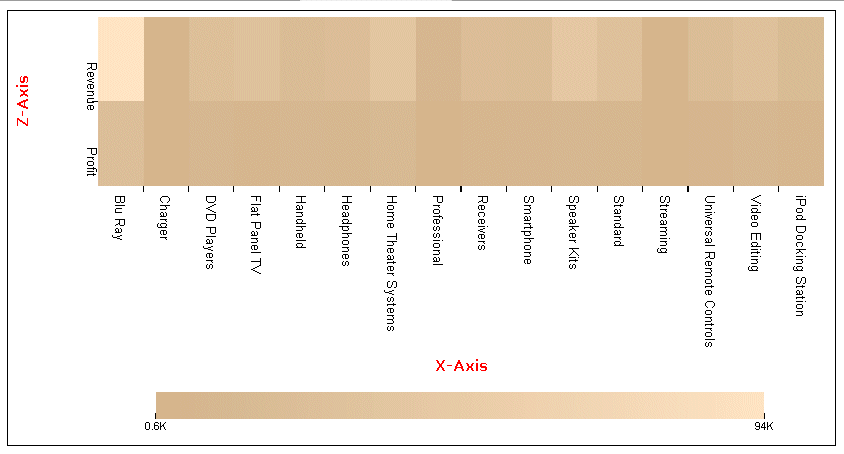
The following request generates a heatmap with x- and z-axis titles in red, with font bold 10pt Verdana:
GRAPH FILE WF_RETAIL_LITE
SUM  REVENUE_US AS 'Revenue'
        GROSS_PROFIT_US AS 'Profit'
BY PRODUCT_SUBCATEG
ON GRAPH PCHOLD FORMAT JSCHART
ON GRAPH SET LOOKGRAPH SPECTRAL
ON GRAPH SET STYLE *
*GRAPH_JS
"colorScale": {"colors": ["tan", "bisque"]},
"xaxis": {"title": {
	"visible": true, "color": "red", "font": "bold 10pt Verdana", "text": "X-Axis"}},
"zaxis": {"title": {
	"visible": true, "color": "red", "font": "bold 10pt Verdana", "text": "Z-Axis"}}
*END
ENDSTYLE
END
The output is:
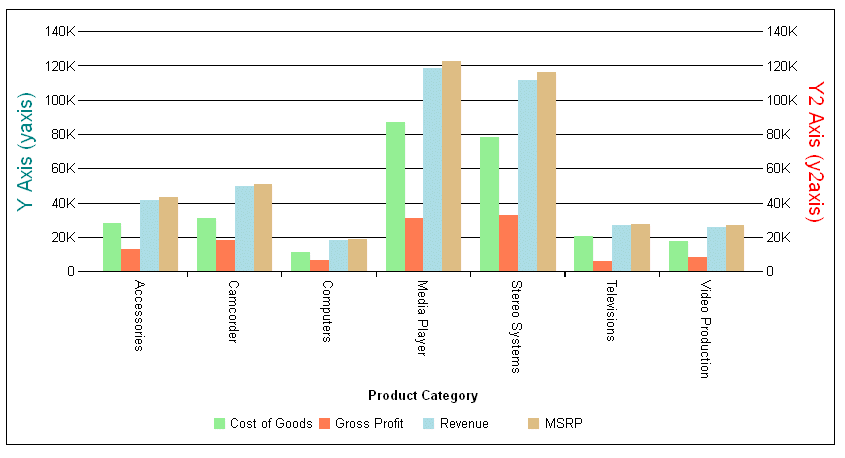
The following request assigns two series to the y-axis and two to the y2-axis and formats the titles for those axes:
GRAPH FILE WF_RETAIL_LITE
SUM COGS_US GROSS_PROFIT_US REVENUE_US MSRP_US
ACROSS PRODUCT_CATEGORY
ON GRAPH PCHOLD FORMAT JSCHART
ON GRAPH SET LOOKGRAPH VBAR
ON GRAPH SET STYLE *
*GRAPH_JS
"yaxis": {"title": {
	"visible": true, "text": "Y Axis (yaxis)", "font": "14pt Sans-Serif", "color": "teal"}},
"y2axis": {"title": {
	"visible": true, "text": "Y2 Axis (y2axis)", "font": "14pt Sans-Serif", "color": "red"}},
"series": [
	{"series": 0, "color": "lightgreen", "yAxisAssignment": 1},
	{"series": 1, "color": "coral", "yAxisAssignment": 2},
	{"series": 2, "color": "lightblue", "yAxisAssignment": 1},
	{"series": 3, "color": "burlywood", "yAxisAssignment": 2}]
*END
ENDSTYLE
END
The output is:
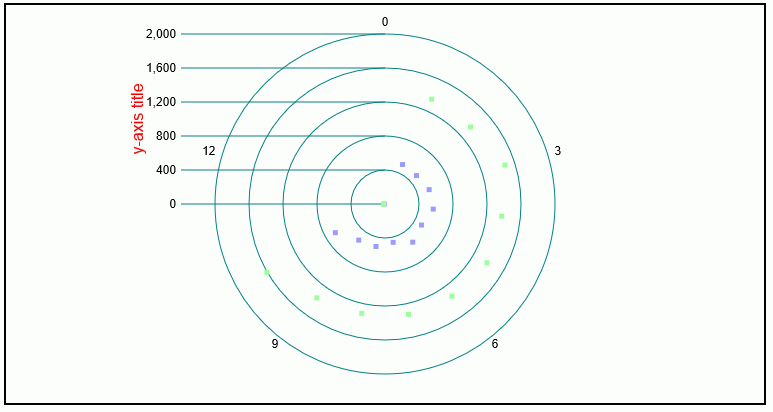
The following request generates a polar chart and formats the y-axis label:
GRAPH FILE WF_RETAIL_LITE
SUM DAYSDELAYED QUANTITY_SOLD
ACROSS TIME_MTH
ON GRAPH PCHOLD FORMAT JSCHART
ON GRAPH SET LOOKGRAPH POLAR
ON GRAPH SET STYLE *
*GRAPH_JS
"legend": {"visible": false},
"polarProperties": {"straightGridLines": false, "extrudeAxisLabels": true},
"yaxis": {
	"title": {"visible": true,
		"text": "y-axis title", "font": "12pt Sans-Serif", "color": "red"},
	"majorGrid": {"visible": true, "lineStyle": {"width": 1, "color": "teal"}
		}}
*END
ENDSTYLE
END
The output is:
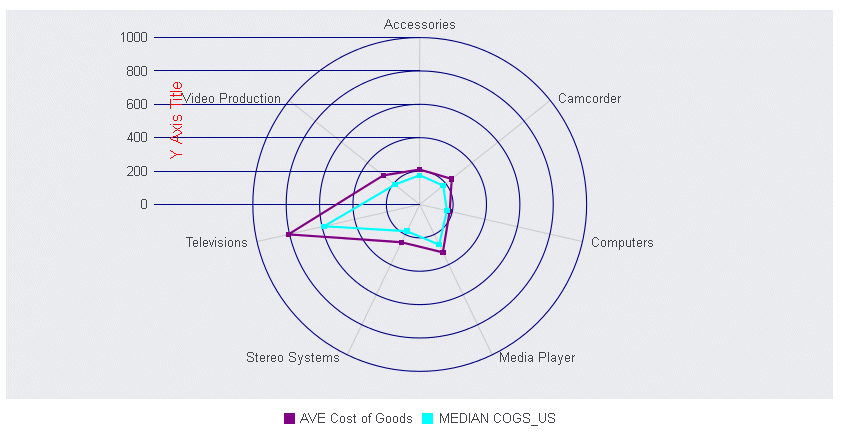
The following request generates a radar chart with a y-axis title:
GRAPH FILE WF_RETAIL_LITE
SUM AVE.COGS_US MDN.COGS_US
BY PRODUCT_CATEGORY
ON GRAPH PCHOLD FORMAT JSCHART
ON GRAPH SET LOOKGRAPH RADARL
ON GRAPH SET STYLE *
INCLUDE=IBFS:/FILE/IBI_HTML_DIR/javaassist/intl/EN/ENIADefault_combine.sty,$
*GRAPH_JS
"legend": {"visible": true},
"polarProperties": {"extrudeAxisLabels": true},
"yaxis": {
	"title": {"visible": true, "text": "Y Axis Title",
		"font": "12pt Sans-Serif", "color": "red"},
	"majorGrid": {"lineStyle": {"width": 1, "color": "navy"}}},
"series": [
	{"series": 0, "color": "purple", "border": {"width": 2}},
	{"series": 1, "color": "cyan", "border": {"width": 2}}]
*END
END
The output is:
Defining the Position of the Y-Axis or Y2-Axis Title
|
How to: |
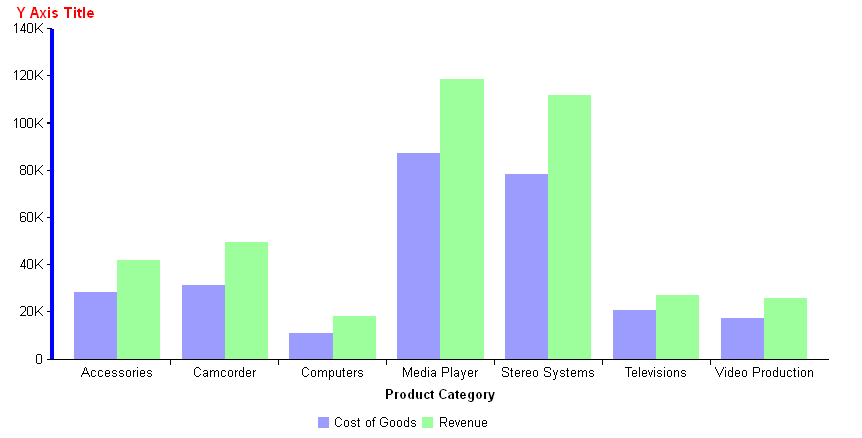
The "position": "orthogonal" property places the y-axis or y2-axis title above and centered over the y-axis or y2-axis body line.
Syntax: How to Position the Y-Axis Title Over the Y-Axis Body Line
"axisname": {
   "title":{
     "visible": true,
     "position": "orthogonal"
}
}
where:
- "axisname"
-
Can be one of the following:
- "yaxis"
- "y2axis"
Example: Positioning the Y-Axis Title Over the Y-Axis Body Line
The following request makes the y-axis title red and bold 10pt Arial, and places it over the y-axis body line:
GRAPH FILE WF_RETAIL_LITE
SUM COGS_US REVENUE_US
BY PRODUCT_CATEGORY
ON GRAPH PCHOLD FORMAT JSCHART
ON GRAPH SET LOOKGRAPH VBAR
ON GRAPH SET STYLE *
*GRAPH_JS
"border": {"width": 0},
"yaxis": {
	"title": {"visible": true, "position": "orthogonal",
		"text": "Y Axis Title", "font": "bold 10pt Arial", "color": "red"},
	"bodyLineStyle": {"width": 4, "color": "blue"}}
*END
ENDSTYLE
END
The output is:
| WebFOCUS | |
|
Feedback |