Reversing the Default Axis Locations
|
How to: |
The swapChartSide property controls the location of the axis body line and labels. In the default configuration, the y-axis body line and labels appear on the bottom of a horizontal chart and the left side of a vertical chart. The y2-axis body line and labels appear on the top of a horizontal chart and the right side of a vertical chart. In Bubble and Scatter charts, the x-axis normally appears on the bottom of the chart and the y-axis on the left side of the chart. This property can be used to reverse these default locations.
Syntax: How to Reverse Default Axis Locations
"axisname": {
  "swapChartSide": boolean  }
where:
- "axisname"
-
Can be:
- xaxis
- yaxis
- "swapChartSide": boolean
-
Can be:
- true, which swaps axis label and body line locations.
- false, which uses the default axis locations. This is the default value.
Example: Reversing the Default Axis Positions
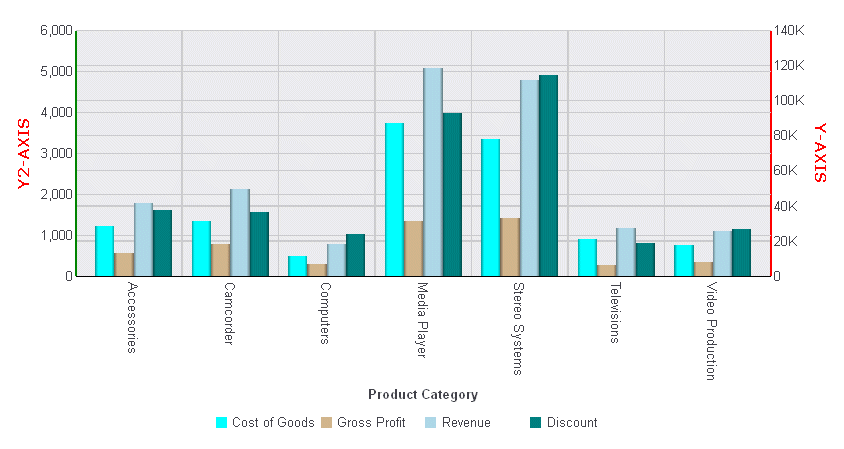
The following request assigns series 3 to the y2-axis and swaps the y2-axis with the y-axis:
GRAPH FILE WF_RETAIL_LITE
SUM COGS_US GROSS_PROFIT_US REVENUE_US DISCOUNT_US
ACROSS PRODUCT_CATEGORY
ON GRAPH PCHOLD FORMAT JSCHART
ON GRAPH SET LOOKGRAPH VBAR
ON GRAPH SET STYLE *
INCLUDE=IBFS:/FILE/IBI_HTML_DIR/javaassist/intl/EN/ENIADefault_combine.sty,$
*GRAPH_JS
"yaxis": {
	"title": {
		"visible": true,"color": "red", "font": "bold 10pt Verdana",
		"text": "Y-AXIS"},
	"bodyLineStyle": {"width": 2, "color": "red"},
	"swapChartSide": true},
"y2axis": {
	"title": {
		"visible": true, "color": "red", "font": "bold 10pt Verdana",
		"text": "Y2-AXIS"},
	"bodyLineStyle": {"width": 2, "color": "green"}},
"series": [
	{"series": 0, "color": "cyan"},
	{"series": 1, "color": "tan"},
	{"series": 2, "color": "lightblue"},
	{"series": 3, "color": "teal","yAxisAssignment": 2}]
*END
ENDSTYLE
END
On the output, the y-axis has been moved to the right side of the chart, and the y2-axis is on the left:
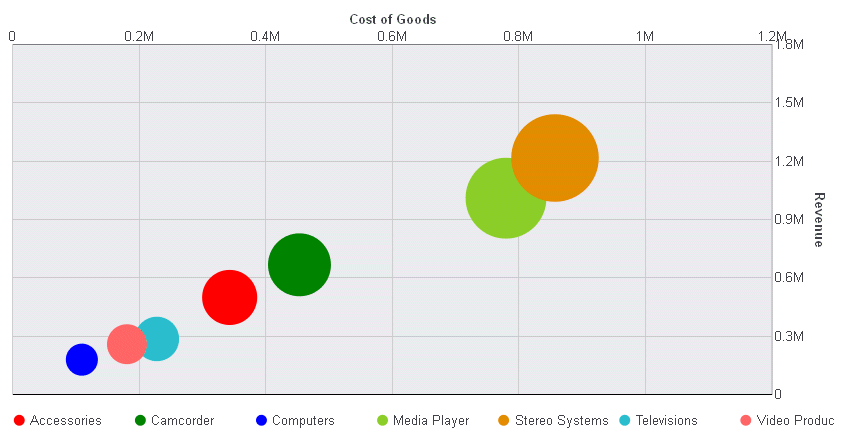
The following request generates a bubble chart with the y-axis on the right, and the x-axis on the top:
GRAPH FILE WF_RETAIL_LITE
SUM COGS_US REVENUE_US DISCOUNT_US
BY PRODUCT_CATEGORY
ON GRAPH PCHOLD FORMAT JSCHART
ON GRAPH SET LOOKGRAPH BUBBLE
ON GRAPH SET STYLE *
INCLUDE=IBFS:/FILE/IBI_HTML_DIR/javaassist/intl/EN/ENIADefault_combine.sty,$
*GRAPH_JS
"yaxis": {"swapChartSide": true},
"xaxis": {"swapChartSide": true},
"series": [
	{"series": "all", "marker": {"shape": "circle"}},
	{"series": 0, "color": "red"},
	{"series": 1, "color": "green"},
	{"series": 2, "color": "blue"}]
*END
ENDSTYLE
END
The output is:
| WebFOCUS | |
|
Feedback |