Setting the Axis Mode
|
How to: |
The mode property sets the axis mode as ordinal, numeric, time, or color. The axis mode is typically set to undefined which allows the charting engine to automatically set the mode based on the data.
Syntax: How to Set the Axis Mode
"axisname": {
  "mode": "string"
  }
where:
- "axisname"
-
Can be:
- "xaxis"
- "yaxis"
- "zaxis"
- "mode": "string"
-
Is a string that specifies the axis mode. If the value is undefined, the mode is automatically chosen based on the data. Other supported values are:
- "ordinal"
- "numeric"
- "time"
- "color"
Note: For heatmap, tagcloud, and treemap charts, you can set mode to "color" and define colorScale colors to define the coloring of cells in heatmaps and treemaps, and the coloring of labels in tagclouds.
Example: Setting the Axis Mode
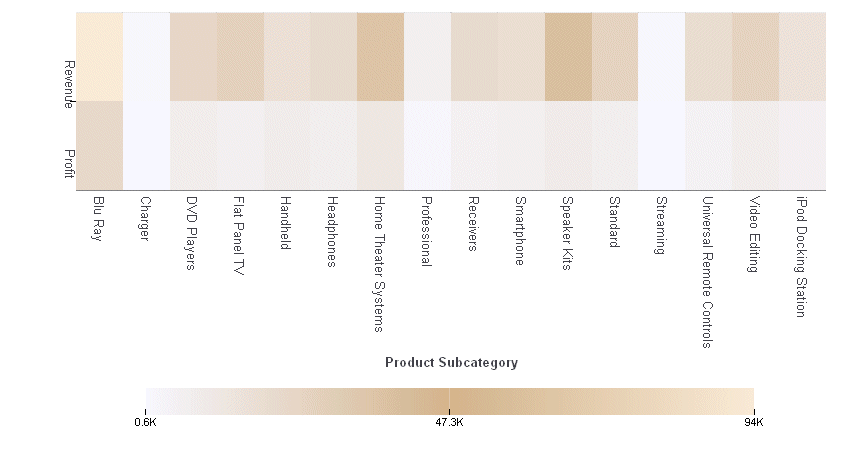
The following request generates a heatmap chart whose y-axis mode is set to "color" and whose color scale consist of the colors ghost white, tan, and antique white:
GRAPH FILE WF_RETAIL_LITE
SUM  REVENUE_US AS 'Revenue'
        GROSS_PROFIT_US AS 'Profit'
BY PRODUCT_SUBCATEG
ON GRAPH PCHOLD FORMAT JSCHART
ON GRAPH SET LOOKGRAPH SPECTRAL
ON GRAPH SET STYLE *
INCLUDE=IBFS:/FILE/IBI_HTML_DIR/javaassist/intl/EN/ENIADefault_combine.sty,$
*GRAPH_JS
"yaxis": {"mode": "color"},
"colorScale": {"colors": ["ghostwhite", "tan", "antiquewhite"]}
*END
ENDSTYLE
END
The output is:

| WebFOCUS | |
|
Feedback |