Formatting a Scrolling X-Axis
|
How to: |
The xaxis:labelLayout:scroll property enables or disables x-axis scrolling. Even if scrolling is enabled, it will only be implemented when needed. You have a choice between two forms of scroll bar:
- A standard scroll bar.
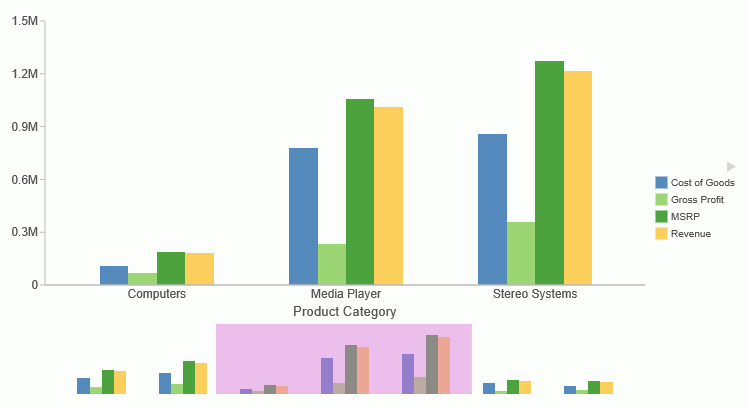
- A minichart, in which the scroll bar background is a compressed version of the main chart. As you scroll the bar to focus on a portion of the minichart, that portion of the main chart scrolls into the chart frame, if necessary. This type of chart is called a focus-context chart.
Syntax: How to Generate a Scrolling X-Axis
"xaxis": {
			"labelLayout": {"scroll": true},
   "scroll": {
      "style": "string",
          "groups": {
             "minSize": number,
             "maxCount": number
                 },
     "miniChartProperties": {
          "height": number,
          "dataSelection": {
            "selectionRect": {"fill": "rgba(r, g, b, a)" }
                          }
                        }
        }
     }
where:
- "scroll":
-
Defines the properties of a scrolling x-axis.
- "style": "string"
-
Specifies the type of scroll bar. Valid values are:
- "simple", which generates a standard scrollbar. This is the default value.
- "miniChart", which generates a scrollbar whose background is a compressed version of the main chart.
- groups:
-
Defines the scroll bar groups.
- "minSize": number
-
Defines a minimum number of pixels for each group. The default value is "auto", which leaves the decision to the chart engine.
Note: Use either "maxCount" or "minSize". If both "minSize" and "maxCount" are undefined, all groups are fit into the frame and scrollbars are disabled.
- "maxCount": number
-
Specifies the maximum number of groups to show at once, unless fewer are available. The default value is undefined.
Note: Use either "maxCount" or "minSize". If both "minSize" and "maxCount" are undefined, all groups are fit into the frame and scrollbars are disabled.
- "miniChartProperties":
-
Defines the properties of a scroll bar visualized as a minichart.
- "height": number
-
Is the height of the minichart in pixels, or a percent string that represents a percentage of the height of the main chart. The selection rectangle on the scrollable minichart is always the same height as the minichart itself. By default, the minichart height is 20% of the height of the main chart.
- "dataSelection": "selectionRect": "fill": "rgba(r, g, b, a)"
-
Is a color definition and transparency for the selection rectangle. If you use a color definition without a transparency value, the selection rectangle will be fully opaque and block the view of the minichart group on which it is positioned.
Example: Generating a Minichart Scrollbar on the X-Axis
The following request generates a minichart scrollbar on the x-axis. The selection rectangle is orchid and 45% opaque:
GRAPH FILE WF_RETAIL_LITE
SUM COGS_US GROSS_PROFIT_US MSRP_US REVENUE_US
BY PRODUCT_CATEGORY
ON GRAPH PCHOLD FORMAT JSCHART
ON GRAPH SET LOOKGRAPH BAR
ON GRAPH SET STYLE *
INCLUDE=IBFS:/FILE/IBI_HTML_DIR/ibi_themes/Warm.sty,$
*GRAPH_JS
"xaxis": {
	"labelLayout": {"scroll": true},
	"scroll": {
		"style": "miniChart",
		"groups": {"maxCount": 3},
		"miniChartProperties": {
			"height": 70,
			"dataSelection": {"selectionRect": {"fill": "rgba(218, 112, 214, 0.45)"}}
		}}}
*END
TYPE=DATA, COLUMN=COGS_US, BUCKET=y-axis, $
TYPE=DATA, COLUMN=GROSS_PROFIT_US, BUCKET=y-axis, $
TYPE=DATA, COLUMN=MSRP_US, BUCKET=y-axis, $
TYPE=DATA, COLUMN=REVENUE_US, BUCKET=y-axis, $
TYPE=DATA, COLUMN=PRODUCT_CATEGORY, BUCKET=x-axis, $
ENDSTYLE
END
The output is shown on the following image, with the selection rectangle (which spans a maximum of three groups) scrolled to the second block of groups:

| WebFOCUS | |
|
Feedback |