Using Active Technologies
|
Topics: |
This topic provides an overview of Active Technologies and discusses security and active cache processing. It includes additional information about the features of the product that will help you use it.
This topic also describes the features of an Active Technologies report, which is a report that is enabled to use the full capabilities of Active Technologies. An Active Technologies report is also called an active report.
Active Technologies Report Overview
An active report is a report that is designed for offline analysis. When using an active report, you can:
- Interact with the data, using analysis options similar to those found in an Excel® workbook, without any connection to a server. Analysis options include filtering, sorting, charting, and much more.
- Work offline without any additional plug-ins or programs. An active report is a self-contained report, meaning that it contains all the data and JavaScript® within the HTML output file. Packaging the data and the interactive functions in the HTML file also makes the output highly compressible for email and transparent to security systems.
- Save the report on
a local machine with active report functionality. Since no connection
to a server is required to view the data or use the analysis options,
you can save and use the report anywhere.
Note: Performance may vary across browsers due to browser-specific memory limitations. For very large reports, Internet Explorer® may produce an error. For more information, refer to the Microsoft® website.
An active report for Adobe Flash Player includes most of the capabilities available in the HTML version of active reports in a visually enhanced, user-friendly report format. An active report delivered as a self-contained Adobe Flash SWF file that is Adobe Flash Player compatible allows for faster analysis of large data sets and interaction with the active report.
When working with an active report, you can:
- Filter or highlight data.
- Sort data within any column in ascending or descending order.
- Apply calculations to columns and choose the location at which to display results.
- Control the display of data by hiding columns, freezing columns, limiting the number of rows per page, and using graphic visualization to compare column values.
- Create a variety of simple or advanced charts (pie, line, bar, or scatter) and Rollup Tables.
- Apply a global filter to multiple reports within the same HTML page.
- Export report data and chart data.
- Restore original report settings.
- Run active reports on your mobile device with the Opera™ browser (Version 8.60 U2 or higher) installed. See the Opera website for a list of supported devices.
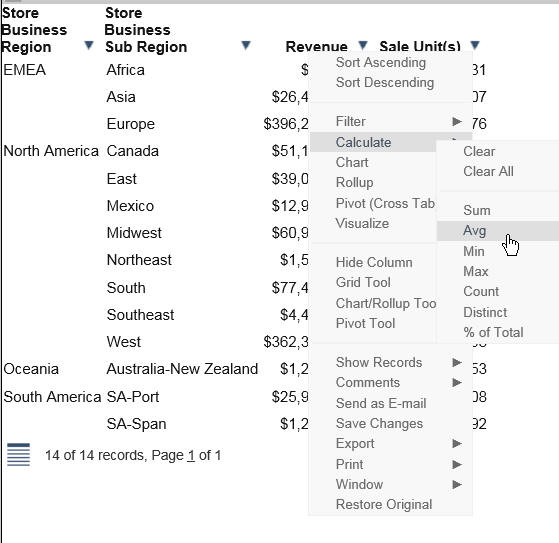
The following image shows an HTML active report. The pop-up menu is open for the Sale Unit(s) column, with the Calculate Avg operator selected.
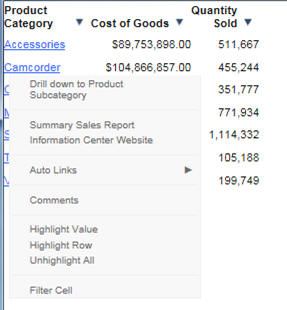
The following image shows the options that are available at the cell level for a report in active report format. Included are the options that reflect Auto Drill, Multi Drill, and Auto Linking functionality. The applicable documentation for your graphical tool contains more information on that functionality.
Security Features
You can password protect an active report. This feature restricts users from viewing the report by requiring them to enter a password before opening the report. The data is encrypted using the 256-bit Advanced Encryption Standard (AES) specification. The password is used as the key for decrypting and encrypting the data. Therefore, the password is not stored in the report, and you do not need a connection to go back to the server for password verification.
The HTML page that you receive contains both the JavaScript and the data for the report so that you can interact with the data in a disconnected mode. Internet Explorer detects the JavaScript and issues a warning. If you look at the Internet Explorer warning, it mentions explicitly the detection of active content, which is the JavaScript. The same warning appears when pop-ups are blocked in the browser.
Handling a Large Amount of Data
Because all post-retrieval processing is performed in the memory of the web browser, an active report has a processing limit of approximately 5,000 records or 100 pages of output. The active cache option enables you to send only the first page of active report output to the browser and retrieve subsequent pages from a temporary cache on the Reporting Server. The server also becomes the resource for performing all calculations, sorting, and filtering when active cache is enabled. Since active cache uses on-demand paging functionality, WebFOCUS Viewer is not supported.
The active report with active cache option in the clustered server environment, using Cluster Manager (CLM), will maintain the connection with the WebFOCUS Reporting Server on which the temporary cache is created. This enables the retrieval of subsequent pages from the browser, while the report is in the same browser session.
The active cache feature uses a POST instead of a GET in an HTTP request.
If your applications run active cache reports that use WebFOCUS Web Services, see the WebFOCUS Web Services manual for more information.
Distribution and Viewing Considerations
Active Technologies stores an active report as an HTML file. The HTML file created by Active Technologies contains both the report data and the JavaScript code that enables you to interact with the data in disconnected mode.
An active report is designed for distribution to users who need to perform offline analysis and interactive functions without connection to a server.
You can save an active report from your web browser to another location. You can also send an active report to another person by email, as an HTML attachment. However, when you distribute an active report, you must keep in mind how it will be viewed.
For example, when you send an active report as an HTML attachment to email, many client email programs on a mobile device can block the JavaScript in the attachment. A third-party tool, such as the Mobile Faves App for a mobile device, may be used to correctly view the attachment.
If you try to view an active report in a web browser, and JavaScript is blocked or disabled on your web browser, you will receive a message reminding you that JavaScript must be enabled on the browser. If you are using a mobile device, the message directs you to use the Mobile Faves App. If the Mobile Faves App is not installed, you can download it from the App Store® for iOS devices or from the Google Play™ store for Android™ devices. In the message, App Store and Google Play store are hyperlinks to the Mobile Faves App.
The message is displayed on the Desktop or on a supported mobile device when JavaScript is disabled in a web browser used to open an online or offline active report. It is also displayed on the Preview pane or window of an application used to preview the content of an offline active report.
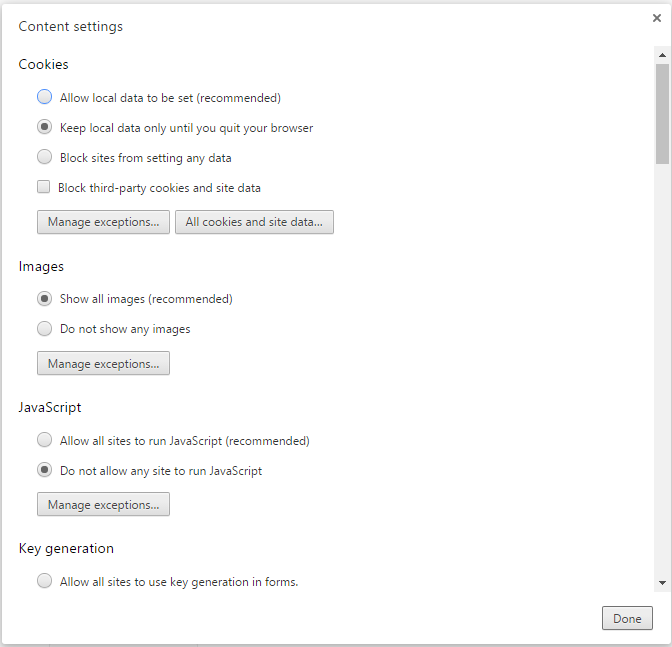
The following image shows JavaScript disabled in Google Chrome™.
Usage Notes for Active Technologies
The following apply to browser support.
- Active PDF (APDF) is an Active Technologies output format. It is not supported in Microsoft Edge®, since APDF requires the Adobe Reader plug-in that supports Flash Player.
- ActiveX, a technology from Microsoft, is not supported in Microsoft Edge. Any Active Technologies feature that requires the
use of ActiveX controls is therefore not available in Microsoft Edge. These features include the following, which are accessible
in other browsers at run time, using the column drop-down menu on an active report:
- Send as E-mail (supported only in Internet Explorer)
- Save Changes (supported only in Internet Explorer)
- Export to XML (Excel) when active cache is disabled
- If you are using a Firefox® browser and you export an AHTML report to Excel, the file extension that displays is incorrect (for example, .xls.xls). You can override this default value using the settings of the browser. Specifically, if you click the Always ask me where to save files radio button, which is located under Options, you will be prompted, upon download, to either open or save the file. You can then provide a name and extension for the file.
The following apply to Active Technologies reports.
- If multiple report components with different security passwords are included in an AHTML document, the password for the last report component is used.
- Active reports employ left and right cell padding, by default. This enables you to view the active report consistently, without the concatenation of any values or spacing issues related to the cell padding. In cases where these settings are not defined in the StyleSheet, the default settings for the left and right cell padding are used.
- By default, Active Technologies displays the name specified in the Master File to identify a column in an ACROSS group on
a tabular active report. With the following SET command, you can display the title specified in the Master File, instead of
the name, to identify the column:
SET ACRSVRBTITL = ON
Active Technologies derives the title from the TITLE attribute in the Master File (for example, TITLE = 'Product ID'). It derives the name from the FIELDNAME or FIELD attribute (for example, FIELD = PCD).
- The Sort Ascending, Sort Descending, and Restore Original options are accessible on a column drop-down menu on an active report. When active cache is enabled on the active report, the Restore Original option does not return the report output to its original state after sorting the data. Instead, you receive the following message: Warning: Original sort could not be determined.
-
When using active content in Cache Mode, filtering may not work properly if the content contains a text field (for example, TX50). As a workaround, consider using an alphanumeric field (for example, A50).
The following apply to Active Technologies charts.
- When working with filters in an AHTML chart, certain filtering options do not display if you have only one column on which to filter and it has a decimal format which includes a decimal point. In this case, the Filter Chart and Exclude from Chart filtering options are not available in the chart tooltip at run time.
- As of Release 8.2 Version 02, the new chart attribute syntax has been applied to the following chart types: Dual Bar and Line,
Tag Cloud, Streamgraph, Mekko, Funnel, and Pyramid. This process adds additional relevant field containers for these chart
types, which can be used to specify fields in a specific area of the chart. For example, Horizontal Axis, Color, and Tooltip
are field containers that are part of the new chart attribute syntax.
In InfoAssist+, specific field containers display for each chart type. For more information on the underlying syntax used to create each chart type, see the Creating HTML5 Charts With WebFOCUS Language manual.
- When you run an active chart, the output displays a chart toolbar with a number of options that you can select. These options
are represented by icons. The active chart toolbar provides an Aggregation icon that allows you to select the aggregation
method (that is, the type of calculation, such as Sum or Avg) that will be used on the selected data in the chart.
If you run an active chart that does not have a measure field to which an aggregation method can be applied, the Aggregation icon:
- Appears on the chart toolbar, but cannot be selected.
- Displays None as the aggregation method. None is dimmed on the label. It indicates that there will be no aggregation performed on, or applied to, the selected data in the chart.
The following applies to Active Technologies tools.
- The comma inclusion edit option is not implemented in Rollup tables and Pivot tables when active cache is enabled.
- Date-time format fields are not supported.
The following apply when using the Export to Excel functionality.
- When using the Export to Excel option while creating and generating an active report with active cache enabled, the request
will be generated in XLSX format rather than EXL2K. This applies to the following browsers: Microsoft Edge, Internet Explorer,
Firefox, and Chrome.
The export behavior is controlled by the WebFOCUS Reporting Server, and an ActiveX plugin is not required for Internet Explorer. When the export is performed, an Office Open XML document is produced, which you can download and save in the required format (default is .xlsx).
- When using the Export to XML (Excel) option with active cache disabled, the export behavior is controlled by the active JavaScript
layer.
An ActiveX plugin is required for Internet Explorer. This is used to export the output directly into Microsoft Excel, enabling you to save the document in the required format (.xlsx or .xls depending on the Microsoft Excel version installed).
In Firefox and Chrome, when the export is performed, an MS Office XML document is produced, which you can download and save in the required format (the default is .xls).
In Microsoft Edge, the Export to XML (Excel) option is not supported. The option is available with active cache disabled, but when the export is performed, the output is displayed as text inside the browser window.
The following apply when using mobile devices.
- The Chrome browser "Force enable zoom" Accessibility setting on Android mobile devices overrides a website request to prevent zooming. If this setting is enabled when executing an AHTML report on an Android mobile device using Chrome, it interferes with active report functionality, such as FREEZE and manual resizing. The Accessibility setting needs to be disabled for active reports to be fully functional.
| WebFOCUS | |
|
Feedback |