Using Interactive Options
To add interactive options to a chart, on the Format tab, in the Interactive Options group, click Interactive Options.
Note: The Interactive group is enabled only when the HTML5 output format is selected for your chart.
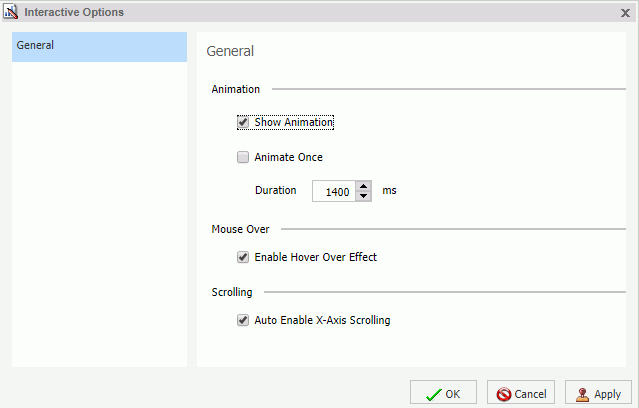
When you click Interactive Options, the Interactive Options dialog box displays. The Interactive Options dialog box enables you to specify animation, mouse over, and scrolling effects in your chart.

Options on the Interactive Options dialog box include:
Animation section
- Show Animation. Enables
you to specify options for animation in your chart. Clear this check
box to disable animation. This option is selected by default.
Note: If the Show Animation check box is cleared, the option to Animate Once is not available.
- Animate Once. Enables you to specify the frequency of chart animation. Select this check box to indicate that the chart should be drawn the first time a procedure is executed, but not on subsequent executions of that procedure. If this check box is not selected, the chart will animate every time the chart is redrawn.
- Duration. Defines
the duration of the animation in milliseconds. You can manually
enter a millisecond value (ms) or use the arrows to adjust the default value,
which is 1400. This value may vary depending on the theme that you
select.
Note: When specifying a duration for an animation, larger numbers produce slower animation.
Mouse Over section
- Enable Hover Over Effect. Controls the display of the mouse over indicator, which shows chart component information when you hover your mouse over an object. This option is selected by default. However, settings in your theme may override this setting.
Scrolling section
- Auto Enable X-Axis Scrolling. Enabled by default in Visualization mode, this option controls the display of scroll bars for bar, line, area, scatter, bubble, and all matrix charts. In all other modes, you must enable the functionality in the Interactive Options dialog box on the Format tab. If you are working with a large dataset, this functionality enables you to use scroll bars to review your data from left to right. If your dataset is smaller, the scroll bar functionality automatically determines if a scroll bar is needed. You can disable and re-enable this option, depending on your display or data viewing requirements.
| WebFOCUS | |
|
Feedback |