Quick Access Toolbar
The Quick Access Toolbar provides access to the most commonly used functions. It is located to the right of the Application main menu button and is always visible no matter which options are selected.
- Create a new report, chart, document, or visualization. Opens the InfoAssist+ splash screen, where you can create a new report, chart, document, or visualization.
- Open existing item. Opens the Open dialog box, where you can select an existing item.
- Save. Saves a report, chart, document, or visualization.
- Undo and Redo. The Undo icon undoes your last action.
The Redo icon repeats your last action.
The Undo icon is enabled (blue) when there is an action to undo. Otherwise, the icon is unavailable (gray). The Redo icon is enabled (blue) when there is an action to redo. Otherwise, the icon is unavailable (gray).
For example, if you add a database field to a report, the Undo icon turns blue. You can now click the Undo icon to remove the database field from the report. The Undo icon turns gray, and the Redo icon turns blue. To restore the field to the report, click the blue Redo icon.
You can also press Ctrl+Z to undo an action, or Ctrl+Y to redo an action.
You can undo and redo up to 25 actions per session. InfoAssist+ maintains the undo and redo list of actions even when you switch between reports.
When a dialog box is open in the application window, you cannot use the Undo and Redo icons. However, when you click OK and close the dialog box, the icons become available for use. With a single click of Undo, you can undo all the actions that you performed in the dialog box, and you can reinstate them with a single click of Redo.
- View code. View the underlying code for the report.
- Procedure Settings. Click the Procedure Settings button to specify and control items for inclusion in a procedure. The Procedure Settings dialog box presents various SET commands which are useful when you need to tailor your report, chart, or document presentation or content to meet your individual needs. For more information, see Using Procedure Settings.
- Create Thumbnail. In InfoAssist+, you can create and store thumbnail images for use in the Business Intelligence Portal. Thumbnail images
allow you to see a snapshot of a report or chart without opening the file. In InfoAssist+, you can create a thumbnail image
by clicking on the Create Thumbnail icon, which is located on the Quick Access toolbar.
You can create thumbnail images when working in Report and Chart mode in InfoAssist+. These images are smaller renditions (220x160px) of your actual report or chart as it displays in Live Preview. Once you create the thumbnail and save the report or chart, you can access the thumbnail image from the file list on the WebFOCUS Home Page, as shown in the following image.
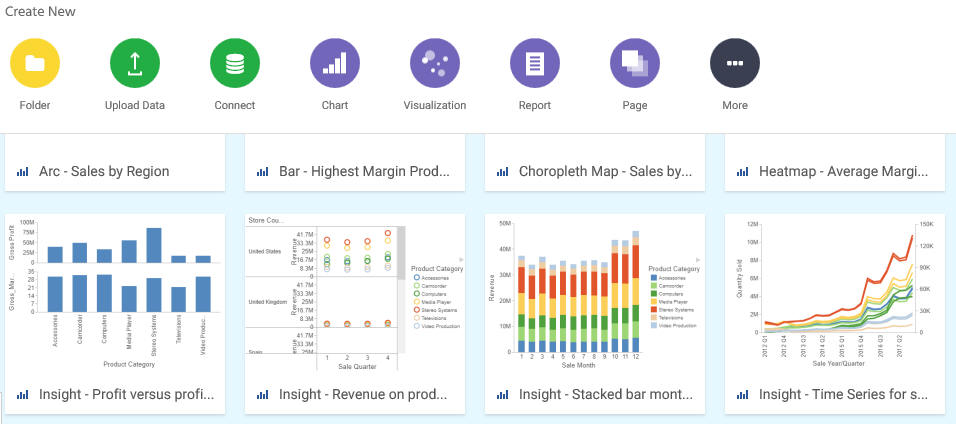
Note: Thumbnail images are stored as part of the procedure when it is saved in the repository. For more information, see How to Create a Thumbnail Image of a Report or Chart.
- Run. Click the Run button to run a report, chart, document,
or visualization immediately. Click the down arrow to open the Run
menu, which contains the following additional options:
- Preview. Runs the report, chart, document, or visualization in the selected format with the limited number of records as set in the Design group on the Home tab.
- Run with Default Parameter Values. Runs a report or chart using the default parameter values. If you have parameters defined, the default value is the first data field defined for the parameter. If you do not have parameters defined, the report or chart will run, regardless.
- SQL Trace. Returns the SQL commands for the request.
- SQL Preview Trace. Returns the SQL commands for the Live Preview run.
| WebFOCUS | |
|
Feedback |