Viewing Data Profiling Characteristics
|
Topics: |
|
How to: |
Data Profiling provides data characteristics for the columns in a synonym. You can display the characteristics for all the columns in a synonym or segment, or for an individual column.
For alphanumeric columns, Data Profiling provides the segment, format, count of distinct values, total count, patterns count, maximum, minimum, and average length, minimum and maximum values, and number of nulls. Patterns count shows the number of patterns found in each alphanumeric column.
For numeric columns, Data Profiling provides the segment, format, count of distinct values, total count, maximum, minimum, and average values, and number of nulls.
Data Profiling for an individual column provides access to Statistics, Patterns, Values, and Outliers reports.
Procedure: How to View Data Profiling for a Synonym or Segment
To view the Data Profiling information for a synonym or segment:
- From the Projects or Data Servers area, open a
synonym by double-clicking a Master File from the Master Files folder.
By default, the Metadata canvas opens to the last view used.
- Right-click the synonym or segment name, select Data Profiling,
and then Statistics.
The Data Profiling information displays in the workspace.
You may use the Data Profiling Results toolbar to view server messages, print the report, copy data as text, and export the report.
- Optionally, you can click a column name or patterns count
(for alphanumeric columns) to drill down to the Values or Patterns
reports, respectively.
This is a partial Values report produced by clicking a column name.
For pattern analysis, a 9 represents a digit, an A represents any uppercase letter, and an a represents any lowercase letter. All printable special characters are represented by themselves and unprintable characters are represented by an X.
Viewing Data Profiling Columns
|
How to: |
Data Profiling can be done for all the columns in a synonym or segment (press the Shift or Ctrl key while selecting multiple columns), or for an individual column. Data Profiling for an individual column provides access to the following reports:
- Statistics. Shows the same information as a Data
Profile report for a synonym or segment.
For alphanumeric columns, the Statistics report provides the segment, format, count of distinct values, total count, patterns count, maximum, minimum, and average length, minimum and maximum values, and number of nulls.
For numeric columns, the Statistics report provides the segment, format, count of distinct values, total count, maximum, minimum, and average values, and number of nulls.
- Hex View. Shows values in Hexadecimal format.
- Patterns. Only available for alphanumeric columns, shows patterns of letters, digits, and special characters, as well as counts and their percents.
- Values. Shows unique values and their percents.
- Values Graph. Displays a graph for alphanumeric field types.
- Values Pie Graph. Displays a pie graph for alphanumeric field types.
- Duplicate Values. Shows identical values and their percents.
- Outliers. Shows the ten highest and lowest distinct values and their counts.
These reports are available by right-clicking a column in the Metadata canvas and selecting Data Profiling.
Procedure: How to View Data Profile Statistics
To view the Statistical Data Profiling information for a single column:
- From the Projects or Data Servers area, open a
synonym by double-clicking a Master File from the Master Files folder.
By default, the Metadata canvas opens to the last view used.
- Right-click a column, select Data Profiling,
and then select Statistics.
The Statistical Data Profiling information opens in the workspace, as shown in the following image.

- Optionally, you can click a column name or patterns count (for alphanumeric columns) to drill down to the Values or Patterns reports, respectively.
Procedure: How to View Data Profile Hex View
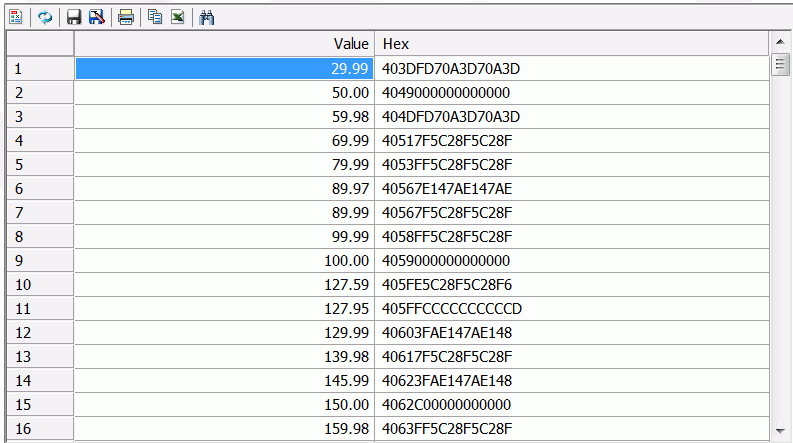
Data Profile Hex View shows values in Hexadecimal format.
To view the Hex View Data Profiling information for a single column:
- From the Projects or Data Servers area, open a
synonym by double-clicking a Master File from the Master Files folder.
By default, the Metadata canvas opens to the last view used.
- Right-click a column, select Data Profiling,
and then select Hex View.
The Patterns Data Profiling information displays, as shown in the following image.
Procedure: How to View Data Profile Patterns
Data Profile Patterns shows patterns of letters, digits, and special characters, as well as counts. This is only available for alphanumeric columns.
To view the Patterns Data Profiling information for a single column:
- From the Projects or Data Servers area, open a
synonym by double-clicking a Master File from the Master Files folder.
By default, the Metadata canvas opens to the last view used.
- Right-click a column, select Data Profiling,
and then select Patterns.
The Patterns Data Profiling information displays, as shown in the following image.
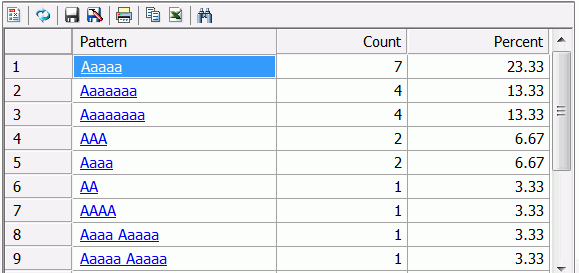
For pattern analysis, a 9 represents a digit, an A represents any uppercase letter, and an a represents any lowercase letter. All printable special characters are represented by themselves and unprintable characters are represented by an X.
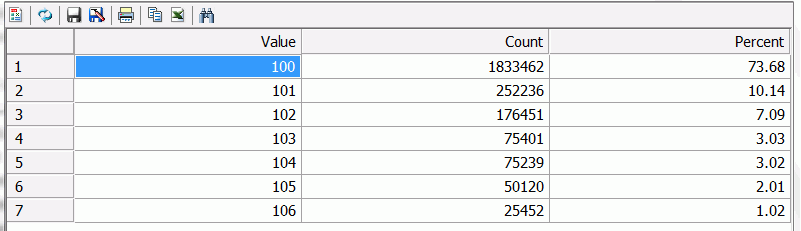
Procedure: How to View Data Profile Values
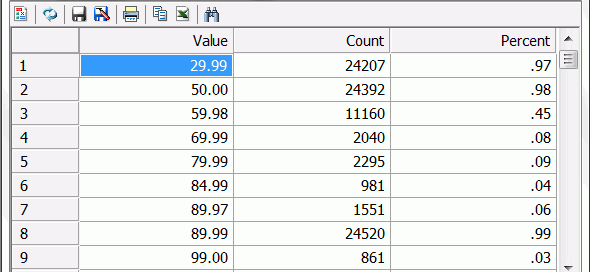
Data Profile Values shows unique values.
To view the Values Data Profiling information for a single column:
- From the Projects or Data Servers area, open a
synonym by double-clicking a Master File from the Master Files folder.
By default, the Metadata canvas opens to the last view used.
- Right-click a column, select Data Profiling,
and then select Values.
The Values Data Profiling information displays, as shown in the following image.
Procedure: How to View the Data Profile Values Graph
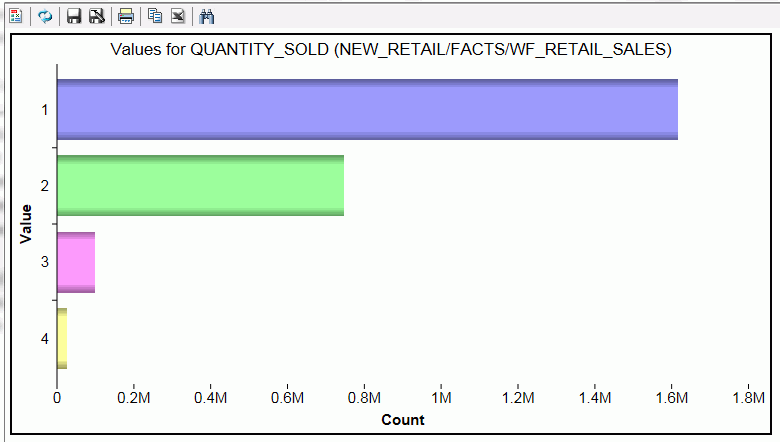
The Data Profile Values Graph displays values as a bar graph.
To view the Values Graph Data Profiling information for a single column:
- From the Projects or Data Servers area, open a
synonym by double-clicking a Master File from the Master Files folder.
By default, the Metadata canvas opens to the last view used.
- Right-click a column, select Data Profiling,
and then select Values Graph.
The Values Graph Data Profiling information displays, as shown in the following image.
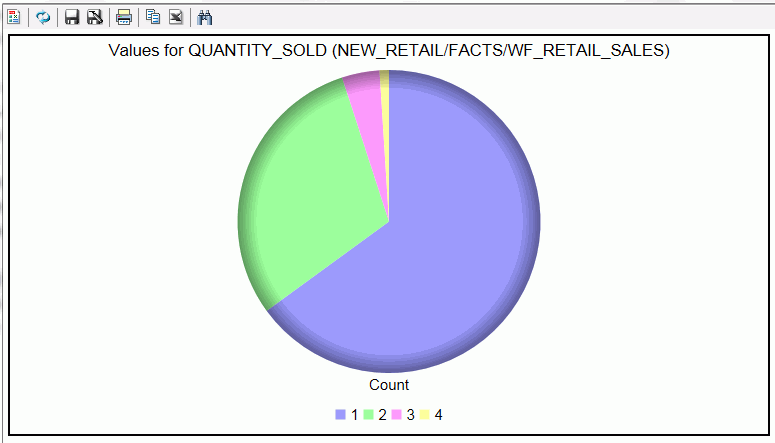
Procedure: How to View the Data Profile Values Pie Graph
The Data Profile Values Pie Graph displays values as a pie graph.
To view the Values Pie Graph Data Profiling information for a single column:
- From the Projects or Data Servers area, open a
synonym by double-clicking a Master File from the Master Files folder.
By default, the Metadata canvas opens to the last view used.
- Right-click a column, select Data Profiling,
and then select Values Pie Graph.
The Values Pie Graph Data Profiling information displays, as shown in the following image.
Procedure: How to View Data Profile Duplicate Values
Data Profile Duplicate Values shows identical values.
To view the Duplicate Values Data Profiling information for a single column:
- From the Projects or Data Servers area, open a
synonym by double-clicking a Master File from the Master Files folder.
By default, the Metadata canvas opens to the last view used.
- Right-click a column, select Data Profiling,
and then select Duplicate Values.
The Duplicate Values Data Profiling information displays, as shown in the following image.
Procedure: How to View Data Profile Outliers
Data Profile Outliers shows the ten highest and ten lowest distinct values.
To view the Outliers Data Profiling information for a single column:
- From the Projects or Data Servers area, open a
synonym by double-clicking a Master File from the Master Files folder.
By default, the Metadata canvas opens to the last view used.
- Right-click a column, select Data Profiling,
and then select Outliers.
The Outliers Data Profiling information displays, as shown in the following image.
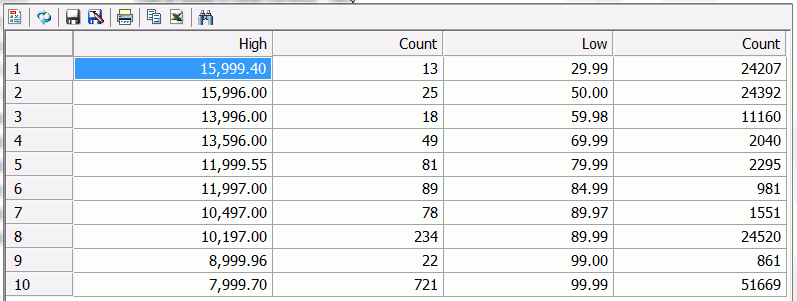
Note: Outliers produce a maximum of the ten highest and ten lowest distinct values, if they exist.
| WebFOCUS | |
|
Feedback |