Explore the features and product innovations that are available in WebFOCUS Release 8.2.03.
Define and enhance your Repository searches to include reports, dashboards, and more with WebFOCUS InfoSearch. You can create a dimensional index to maximize your ability to explore old and new data. You can also use voice search to request information about specific data values, and compare the statistics of multiple data values simultaneously. Combine WebFOCUS InfoSearch with existing WebFOCUS technologies to improve your ability to analyze information and generate insights.
With enhanced auto linking capabilities, you can add optional parameters to your Auto Link reports and charts to increase your list of available Auto Link targets, offering you access to an expanded network of related content. These enhancements also leverage filter parameter values to remember an unlimited number of drill downs automatically.
You can now leverage Intelligent Application Objects (WebFOCUS Reporting Objects) and advanced auto linking capabilities to apply optional parameters in a new, innovative way. From faster content creation to expanded dynamic filtering and simplified application development, you can harness the use of our existing technology like never before.
The new Adaptive Dashboard feature provides a mobile view with a fixed layout that makes any analytical dashboard easier to use while navigating on a mobile device.
In InfoAssist, click the Adaptive Dashboard button on the Layout tab of the ribbon, in the Page Setup group.
On the new App Studio Welcome screen, you can now access the getting started video and a suite of technical how-to videos for App Studio. The new modern layout gives you quick access to the video resources, so you can learn about App Studio visually, as you develop content. It also provides a direct link to App Studio resources that are available on the WebFOCUS 8.2.x Information Center.
Streamline how you upload, create, and modify your data with the enhanced Upload and Connect to Data wizards. The Upload wizard lets you preview and change your data before uploading to a target data source or appending to an existing target data source. A full ribbon-based interface provides various data modification options and preparation techniques. Connect to your choice of data sources using the Connect to Data wizard. You can now quickly and easily create base synonyms and select these base synonyms as facts and dimensions to create a cluster of synonyms in a single dialog.
Newly built-in analytic, or statistical, functions are available within WebFOCUS, allowing you to quickly, and visually, analyze your data. From the Compute dialog box in InfoAssist or the Web Console, you can now quickly access data analysis options, such as K-means clustering, Multiple linear regression, R script execution, and more. Two statistical functions, Standard Deviation and Correlation, are available as verb objects during the aggregation stage of a request as well as in a Compute.
Data Profiling provides data characteristics for the columns in a synonym. Two new options have been added to further enhance data profiling. The new Forecast feature allows data profiling on numeric fields, and displays both the actual data values and the forecasted values in a bar chart. The new Distribution Chart feature displays the most frequent values, along with a report that shows the basic data profiling statistics for the field.
A new geographic role has been added for geometry lines in App Studio. You can use this geographic role to visualize lines on a map in order to visualize streets, transmission lines, routes, and distances. You can also customize the colors, line styles, and thickness of the lines on the map using this new geographic role.
This release of WebFOCUS comes with pre-installed and configured maps. These files enable you to visualize international boundaries for 58 countries down to the postal code level. Enhancements to the geographic configuration file have simplified the list of geographic roles needed. You can also upload your own shapefiles, configure additional Esri® maps, and create new geographic roles for visualizing in maps using the new Geographic Configuration tool.
Insight is a powerful, run-time visualization tool that enables the interactive selection of measures and dimensions, as introduced in Release 8.2.02. Insight Save enhances your experience by allowing you to now save your Insight-enabled charts as you develop them. Each save creates a new file in your repository, enabling you to track your development and review different versions of your chart.
R scripts can now be used in a calculated field (COMPUTE) in WebFOCUS reports and charts. This is accomplished using the new WebFOCUS Adapter for Rserve. Rserve, an open source project, acts as an R server allowing users to run R scripts directly from the WebFOCUS Client or Reporting Server. R models implementing clustering, linear regression, and machine learning appear to business intelligence users as custom user functions.
DataMigrator and WebFOCUS now support additional adapters, allowing for even more ways to access and administer your data.
The Reporting Server supports adapters that are designed to access a wide variety of data sources. The following adapters have been enhanced to make this process even simpler:
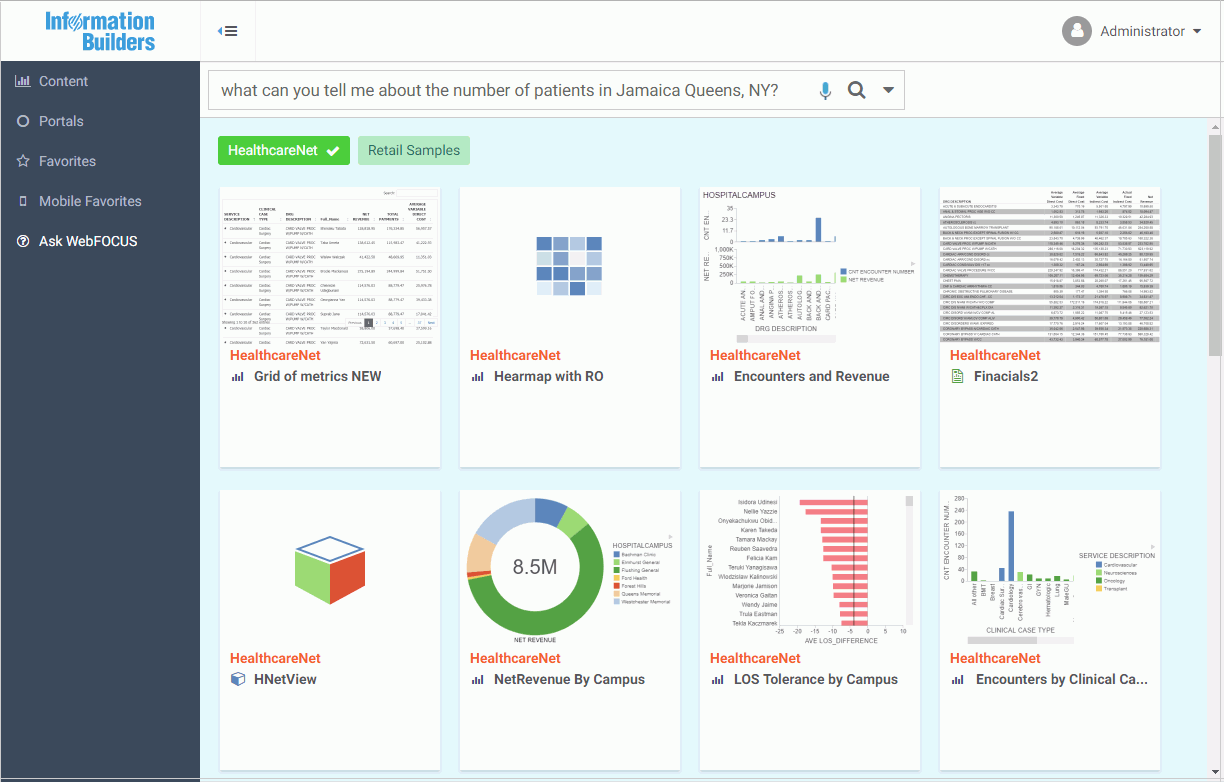
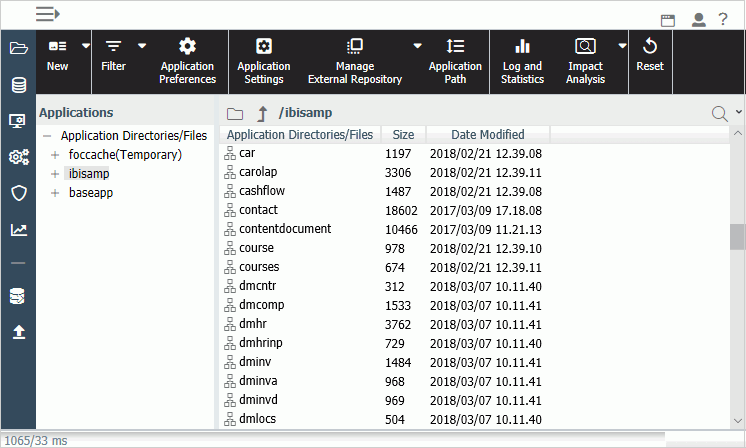
The Reporting Server Web Console and the Data Management Console have both been modernized to provide an easier way for you to view and sort your data. The Application page now lets you view content in various formats, such as icons or lists, while the redesigned Connect to Data page now shows an integrated view of your configured and available adapters. The Connect to Data page has also been enhanced to give you a more streamlined way to create or update synonyms.
You can use the new Dialogue Manager Debugger tool on the Web Console to execute a procedure that contains Dialogue Manager commands, while watching and changing the values of the Dialogue Manager variables in the procedure. You can set and remove breakpoints in the procedure, step into each line of code, step over execution of external procedures, continue to a breakpoint, execute an ad hoc procedure, and open HOLD files created in the procedure. You can save the session information of one debug session.
A Docker container is a standalone executable package containing everything needed to run a piece of software while isolating it from the environment. The server now includes a UNIX/Linux shell script that you can use as a template for turning a configured server into a Docker container. Turning a configuration into a Docker container requires a working Docker environment where the server administrator is allowed to create and manage Docker containers.
Git, a Distributed Version Control System (DVCS), is now supported by the DataMigrator Server. Git can be used in the Reporting Server Web Console and in the Data Management Console.
Git allows multiple developers to work on the same public repository, while locally having a full copy of the public repository. The new Adapter for Git allows you to create a local repository in your Application Directory. Now, using the Adapter for Git, you can work on your local repository in your Application Directory and share files between the local and remote repository.
Kerberos, an authentication protocol that provides a strong authentication for computer networks, is supported by DataMigrator and the WebFOCUS Reporting Server, as well as various data sources, such as Apache Hive™ and Cloudera Impala®. This enhancement allows you to log in to your PC with your credentials, and then connect to our server without having to enter them again. This release has simplified how a Kerberos connection takes place. Now, instead of having to create a profile that contains your Kerberos credentials, you can connect to our server through a browser and then connect outbound to Hive (or other JDBC based adapters), using the same ticket.
DataMigrator has been updated to include the Cluster Manager (CLM), a scalable workload manager that enables distribution of the requests across servers. The addition of CLM to DataMigrator, which automatically switches to other application servers in the event that the main server is unavailable, provides a sense of security to businesses by ensuring that essential functions can continue regardless of a service disruption.
The Reporting Server on z/OS is now a 64-bit version. This implementation allows a larger number of simultaneous agents and connections in a single server instance, provides performance improvements, and enables the server to access additional memory so it can take advantage of modern core language features that require a larger memory footprint. Starting in this release, there are no longer 32-bit versions of the Reporting Server on z/OS.