How to: |
You can create a new report query directly from Excel by accessing the WebFOCUS Quick Data Add-in. Specify connection attributes and the data source for your query, and then build your report using InfoAssist+. You can place multiple queries in the same worksheet, or spread them out over multiple worksheets in a workbook.
There are limitations with queries that overlap. However, there are data layout options available in the Query properties of Excel that can assist with overlapping queries. This behavior is governed by Excel, not WebFOCUS Quick Data.
Note: Quick Data is a WebFOCUS Business User Edition option, which requires a separate license and installation. For more information about licensing Quick Data, contact your Information Builders representative.
- Open an Excel file.
- Select a cell in which to place the query results.
-
With the
Add-Ins tab selected, click the WebFOCUS option
in the Excel menu, and then click Create Query.
You can also right-click any cell and select Create WebFOCUS Query.
-
In the Web Server Connection dialog box, specify the
desired Web Server URL and connection settings, and then click Next.
Note: Do not end the URL with the / sign.
-
If prompted for sign-in credentials, sign in with your
WebFOCUS Business User Edition login and password.
The next screen opens, where you can select a folder to open a list of available data sources.
- Select a folder and click Next.
-
In the Data
Source Selection dialog box, select a Master File, as shown in the
following image, and then click Finish.
InfoAssist+ opens, where you can build a query and run it to return the output data to Excel.
This example covers multiple aspects of creating a new report query using the WebFOCUS Quick Data tool from an Excel file.
- Open an Excel file,
select a cell in which to place the query results, select the ADD-INS tab,
click the WebFOCUS option in the Excel menu,
and select Create Query.
The Web Server Connection dialog box opens.
- In the Web Server
URL field, type the URL for a web server in your reporting environment,
or select one from the drop-down list. An example of a Web Server
URL is:
http://localhost:26000
Note: Do not end the URL with the / sign.
- Click Next.
- Select a folder to open a list of available data sources. In this example we use the Retail Samples folder. Click Next.
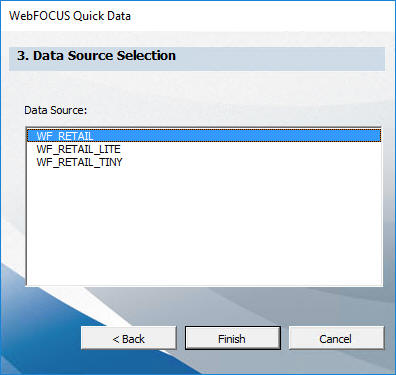
- In the Data Source
Selection dialog box that opens, select WF_RETAIL_LITE from
the Data Source list, and click Finish.
InfoAssist+ opens.
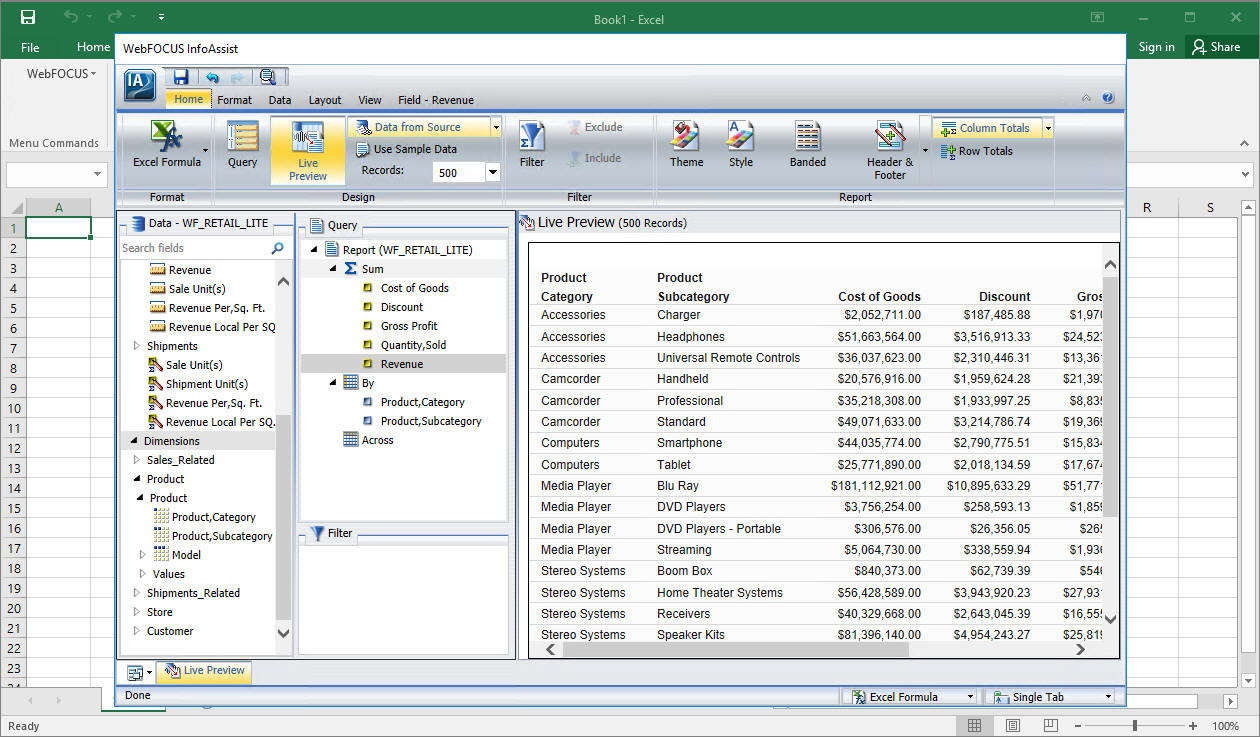
- Drag fields from the Data pane to the Query Pane to create a report.
- On the Home tab, in the Report group, select Column Totals.
After you perform the steps up to this point, the InfoAssist window looks similar to the following.
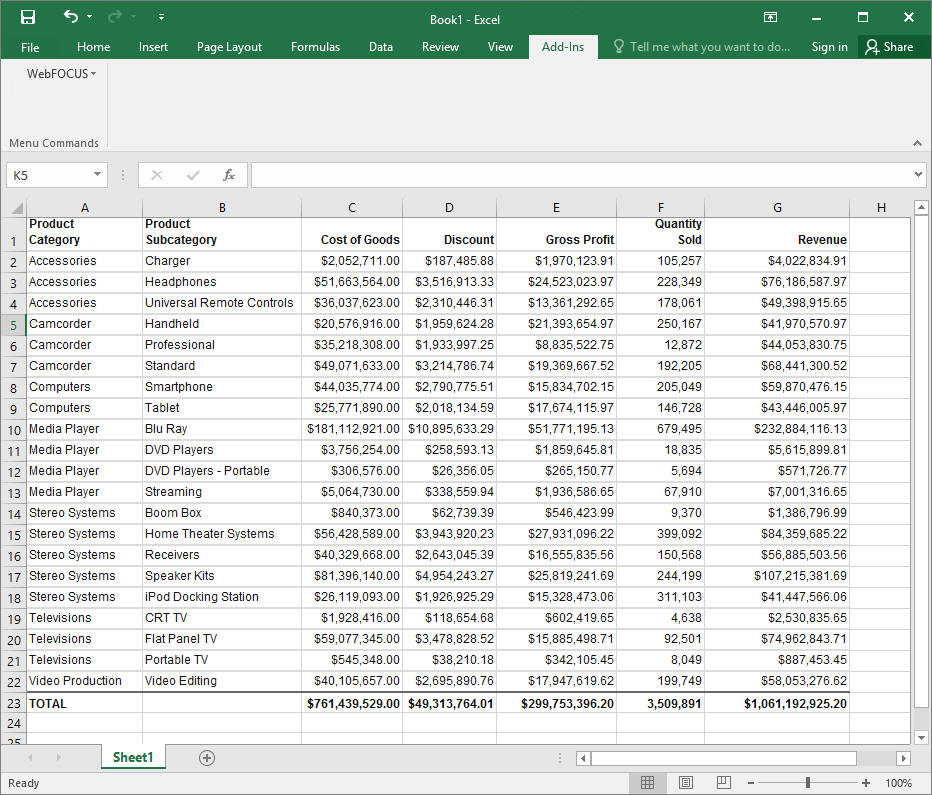
- Click the Save button.
The report query data is transferred to the Excel file, as shown in the following image.
- Click the drop-down
arrow to the right of the Name Box. You will see named ranges that
are automatically added to the query, as shown in the following
image.
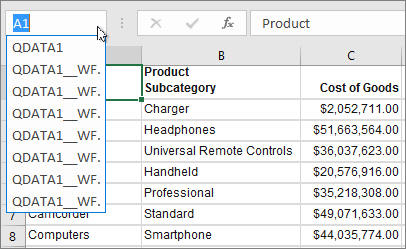
Named ranges are added to the entire data table. The named range for the entire data table is QDATA1.
- Select QDATA1 from the Name Box. The data in the table is automatically highlighted.
- Save the Excel file so that it can be reused in the example on editing an existing report query.
| WebFOCUS |
Feedback |